
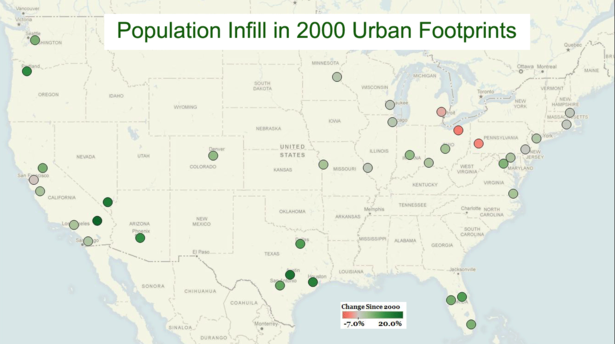
One of the favored strategies of current urban planning is “infill” development. This is development that occurs within the existing urban footprint, as opposed that taking place on the fringe of the urban footprint (suburbanization). For the first time, the United States Bureau of the Census is producing data that readily reveals infill, as measured by population growth, in the nation’s urban areas.
2000 Urban Footprint Populations
The new 2007 estimates relate to urban areas or urban footprints as defined in 2000 and are produced by the American Community Survey program of the Bureau of the Census. Urban areas are the continuous urbanization that one would observe as the lights of a “city” on a clear night from an airplane. It is the extent of development from one side of the urban form to the other. Further, urban areas are not metropolitan areas, which are always larger and are defined by work trip travel patterns. Metropolitan areas always include adjacent rural areas, while urban areas never do.
The Process of Infill
Although embraced with often religious passion within the urban planning community, infill is neither good nor bad in terms of social or environmental impact. Infill always increases population densities and that means more traffic. If road capacity is increased sufficiently, traffic congestion can be kept at previous levels. If on the other hand, nothing is done, traffic congestion is likely to increase along with population. This means slower traffic and more stop and go operations, which inevitably increases the intensity of air pollution with the potential to cancel out any reductions in greenhouse gas emissions (GHG) that might occur if average car trip lengths decline. Similar difficulties can occur with respect to other infrastructure systems, such as sewer and water. Expanding roads, sewer and water systems in already developed areas can be far more expensive than new systems on greenfield sites. Regrettably, boosters of infill routinely ignore these issues.
But infill has been going on for years, along with suburbanization, both in the United States and in other first world nations. This is indicated by the general densification trend that occurred in US urban areas between 1990 and 2000 and the longer term densification trends that occurred in a number of southwestern urban areas, such as Los Angeles, San Jose, Riverside-San Bernardino, Phoenix, Dallas-Fort Worth and Las Vegas. All these traditionally “sprawling” areas have, in fact, been densifying since 1960 or before. Since 2000, 33 of the nation’s 37 urban areas with a population exceeding 1,000,000 population experienced population infill to their 2000 urban footprints.
Infill in Traditionally Regulated Markets (More Responsive Markets)
Infill is a natural consequence of the traditional post-World War II land use regulation, which tends towards accommodating both demographic growth and market forces. This has been replaced by more prescriptive (often called “smart growth”) land use regulation in some urban areas. Under traditional regulation, suburban development followed a “leap frog” process, moving ever further out. This is roundly condemned in today’s planning literature and among leading academics and policy makers.
Leap frog development occurs where urban development skips over empty land and creates a less continuous urban fabric. Land is developed based upon the interplay between sellers and buyers. Due to fewer planning restrictions, no seller can be sure that their land will be purchased since there is always plenty of land that buyers can otherwise purchase. This keeps land prices down. In the more responsive markets, it is typical for land and site infrastructure costs to be 20 percent of the total price land and house price.
Infill occurs as land that has been “leaped” over is subsequently purchased for development. Again, because buyers have plenty of choices, prices of the infill land remains low, so that land and infrastructure costs remain relatively affordable in relationship to the overall new house purchase price.
The result is an urban area that is generally continuous, though with a transitional “ragged edge.” The ragged edge enabled the broad expansion of home ownership that occurred in the decades following World War II by keeping house prices low.
Infill in More Prescriptive Markets (Smart Growth)
The infill process is quite dramatically different in more prescriptive markets. Infill might be mandated as a percentage of total development or by severely limiting the development allowed to occur closer to the urban fringe. Sellers of land on which development is permitted have disproportionate power to charge higher prices because the planning regime seriously limits the availability of alternative sites for buyers. This, of course, flows through to house prices. The share of land and site infrastructure can rise to two-thirds of the house and land cost. The urban area may have a “clearer” edge, but at a significant loss in housing affordability.
Infill Trends in the 2000s
The new infill estimates indicate that American urban areas continue to densify. Between 2000 and 2007, the 33 of the 37 urban areas of more than 1,000,000 population experienced densification in their 2000 urban footprints. The average population infill increase was 5.6 percent (See Table the following table).
| Population Infill in 2000 Urban Footprints | |||||||
| 2000-2007 | |||||||
| Population Change: 2000 Urban Footprint | Population Density of 2000 Urban Footprint in 2007 | ||||||
| Urban Area | 2000 Census | 2007 Estimate | Change | % | Rank | Rank | |
| Riverside--San Bernardino, CA | 1,506,816 | 1,800,117 | 293,301 | 19.5% | 1 | 4,110 | 8 |
| Atlanta, GA | 3,499,840 | 4,118,485 | 618,645 | 17.7% | 2 | 2,100 | 36 |
| Austin, TX | 901,920 | 1,051,962 | 150,042 | 16.6% | 3 | 3,308 | 17 |
| Las Vegas, NV | 1,314,357 | 1,518,835 | 204,478 | 15.6% | 4 | 5,311 | 5 |
| Houston, TX | 3,822,509 | 4,370,475 | 547,966 | 14.3% | 5 | 3,377 | 16 |
| Portland, OR--WA | 1,583,138 | 1,779,705 | 196,567 | 12.4% | 6 | 3,755 | 12 |
| Phoenix, AZ | 2,907,049 | 3,254,634 | 347,585 | 12.0% | 7 | 4,078 | 9 |
| Dallas--Fort Worth, TX | 4,145,659 | 4,549,281 | 403,622 | 9.7% | 8 | 3,236 | 18 |
| Orlando, FL | 1,157,431 | 1,267,976 | 110,545 | 9.6% | 9 | 2,799 | 24 |
| San Antonio, TX | 1,327,554 | 1,440,794 | 113,240 | 8.5% | 10 | 3,540 | 14 |
| Tampa--St. Petersburg, FL | 2,062,339 | 2,209,067 | 146,728 | 7.1% | 11 | 2,754 | 25 |
| Sacramento, CA | 1,393,498 | 1,488,647 | 95,149 | 6.8% | 12 | 4,034 | 10 |
| Seattle, WA | 2,712,205 | 2,896,844 | 184,639 | 6.8% | 13 | 3,040 | 21 |
| Miami, FL | 4,919,036 | 5,243,679 | 324,643 | 6.6% | 14 | 4,703 | 6 |
| Washington, DC--VA--MD | 3,933,920 | 4,174,187 | 240,267 | 6.1% | 15 | 3,611 | 13 |
| Denver, CO | 1,984,887 | 2,087,803 | 102,916 | 5.2% | 16 | 4,192 | 7 |
| Indianapolis, IN | 1,218,919 | 1,278,687 | 59,768 | 4.9% | 17 | 2,316 | 34 |
| Columbus, OH | 1,133,193 | 1,175,132 | 41,939 | 3.7% | 18 | 2,960 | 22 |
| Kansas City, MO--KS | 1,361,744 | 1,408,900 | 47,156 | 3.5% | 19 | 2,413 | 31 |
| Virginia Beach, VA | 1,394,439 | 1,442,494 | 48,055 | 3.4% | 20 | 2,742 | 26 |
| San Jose, CA | 1,538,312 | 1,588,544 | 50,232 | 3.3% | 21 | 6,110 | 2 |
| Los Angeles, CA | 11,789,487 | 12,171,625 | 382,138 | 3.2% | 22 | 7,302 | 1 |
| Cincinnati, OH--KY--IN | 1,503,262 | 1,546,730 | 43,468 | 2.9% | 23 | 2,305 | 35 |
| Baltimore, MD | 2,076,354 | 2,133,371 | 57,017 | 2.7% | 24 | 3,128 | 19 |
| San Diego, CA | 2,674,436 | 2,747,620 | 73,184 | 2.7% | 25 | 3,514 | 15 |
| New York, NY--NJ--CT | 17,799,861 | 18,223,567 | 423,706 | 2.4% | 26 | 5,440 | 4 |
| Minneapolis--St. Paul, MN | 2,388,593 | 2,438,359 | 49,766 | 2.1% | 27 | 2,727 | 27 |
| Chicago, IL--IN | 8,307,904 | 8,467,804 | 159,900 | 1.9% | 28 | 3,992 | 11 |
| St. Louis, MO--IL | 2,077,662 | 2,103,040 | 25,378 | 1.2% | 29 | 2,540 | 30 |
| Milwaukee, WI | 1,308,913 | 1,324,365 | 15,452 | 1.2% | 30 | 2,719 | 28 |
| Boston, MA--NH--RI | 4,032,484 | 4,077,659 | 45,175 | 1.1% | 31 | 2,350 | 33 |
| Providence, RI--MA | 1,174,548 | 1,183,622 | 9,074 | 0.8% | 32 | 2,353 | 32 |
| Philadelphia, PA--NJ--DE--MD | 5,149,079 | 5,178,918 | 29,839 | 0.6% | 33 | 2,880 | 23 |
| San Francisco, CA | 3,228,605 | 3,214,137 | (14,468) | -0.4% | 34 | 6,099 | 3 |
| Detroit, MI | 3,903,377 | 3,831,575 | (71,802) | -1.8% | 35 | 3,041 | 20 |
| Pittsburgh, PA | 1,753,136 | 1,687,509 | (65,627) | -3.7% | 36 | 1,981 | 37 |
| Cleveland, OH | 1,786,647 | 1,705,917 | (80,730) | -4.5% | 37 | 2,641 | 29 |
| Total | 116,773,113 | 122,182,066 | 5,408,953 | 5.6% | |||
| Data from US Bureau of the Census | |||||||
Riverside-San Bernardino, long castigated as a “sprawl” market, had the largest population infill, at 19.5 percent. Atlanta ranked number two, at 17.7 percent. This is a real surprise, since Atlanta was the least dense major urban area in the world in 2000, ranked second in 2000s infill. As a result, it is likely that Pittsburgh- often held up as a model of urban regeneration - is now the world’s least dense major urban area. On the other hand, if Atlanta’s infill rate continues, its 2000 urban footprint will be more dense than that of Boston by 2015.
Austin ranked third, adding 16.6 percent population to its 2000 urban footprint. Las Vegas ranked fourth, with a 15.6 percent increase in its 2000 urban footprint. The density of Las Vegas is increasing so rapidly that by the 2010 census its 2000 urban footprint will be more dense than the 2000 New York urban footprint, should the current rates continue.
Perhaps most surprising of all is that Houston ranked fifth, added 14.3 percent to its 2000 urban footprint. This may surprise those who have denounced Houston’s largely deregulated regulatory environment, both in the city and in unincorporated county areas in the suburbs. Yet overall Houston’s infill exceeded that of smart growth model Portland. The Rose City stood at sixth, adding 12.4 percent to its 2000 urban footprint.
Perhaps equally surprising, Portland remains less dense than average for a western urban area. Its 2000 urban footprint density trailing Los Angeles, San Jose, San Francisco, Las Vegas, Denver, Riverside-San Bernardino, Phoenix and Sacramento, while leading only San Diego and Seattle.
The top ten were rounded out by Phoenix (7th), Dallas-Fort Worth (8th), Orlando (9th) and San Antonio (10th). It is worth noting that like Houston, the unincorporated suburbs of Austin, Dallas-Fort Worth and San Antonio have largely deregulated land use regulation, yet these urban areas ranked high in infill.
Interestingly some of the greatest infill growth also took place in the fastest growing, traditionally “sprawling” cities. Atlanta also had the largest numeric increase in the population of its 2000 urban footprint, at more than 600,000. Houston was a close second, at nearly 550,000.
In contrast, population losses since 2000 in the urban footprints of Cleveland, Pittsburgh, Detroit and San Francisco, means these urban areas experienced no population infill. San Francisco’s loss enabled San Jose to move into second position nationally after Los Angeles in the population density of its 2000 urban footprint.
How the Core Cities Fared
The core cities (municipalities) attracted, on average, their population share. Approximately 30 percent of the infill growth occurred inside the core cities. Even this figure may be a bit high, due to the impacts of annexation
All of the infill in Philadelphia, Baltimore, Chicago, Providence and Minneapolis-St. Paul occurred outside the core cities. The city of Portland attracted barely 10 percent of its urban area infill, despite highly publicized (and subsidized) infill projects such as the Pearl District. Core cities attracted the largest share of infill growth in such diverse cities as San Antonio, San Jose, Columbus, Phoenix and New York.
Note: Additional information available at http://www.demographia.com/db-uzafoot2007.pdf
Wendell Cox is a Visiting Professor, Conservatoire National des Arts et Metiers, Paris. He was born in Los Angeles and was appointed to three terms on the Los Angeles County Transportation Commission by Mayor Tom Bradley. He is the author of “War on the Dream: How Anti-Sprawl Policy Threatens the Quality of Life.”


learn more
Unlocking and Jail breaking the iPhone 4S is almost a rage amongst the iPhone userslearn more
Really it is nice post
Really it is nice post, The post is clearly highlighting the values of law. It is now being necessary for all of us to understand law and its values.
visit here |click here
uk web site |uk web site
sdfa
sdfa