
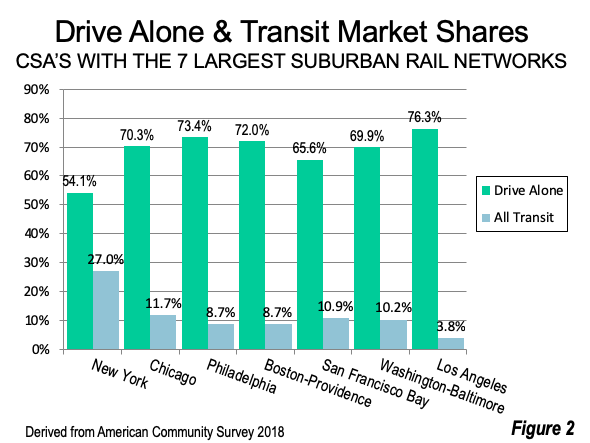
The long, streaking commuter trains (suburban rail) carrying workers mostly into and out of downtown every day may give the impression of “rapid transit.” However, regardless of the top speeds they reach, the average suburban rail rider spends far more time traveling to work than those using other modes of getting to work (Figure 1). They spend far longer than the majority of commuters, who drive alone. Even in the New York combined statistical area (CSA), with the largest suburban rail network a majority drive to work (Figure 2).
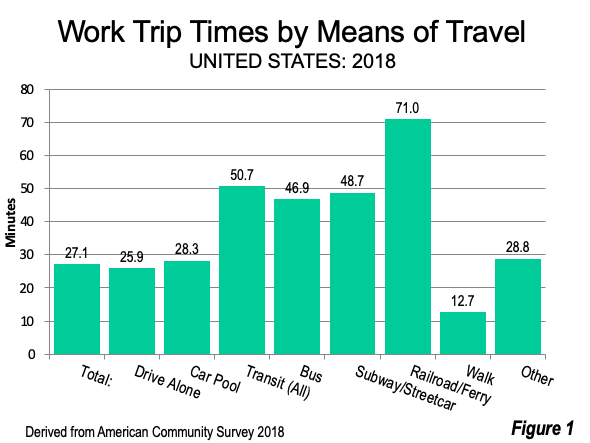
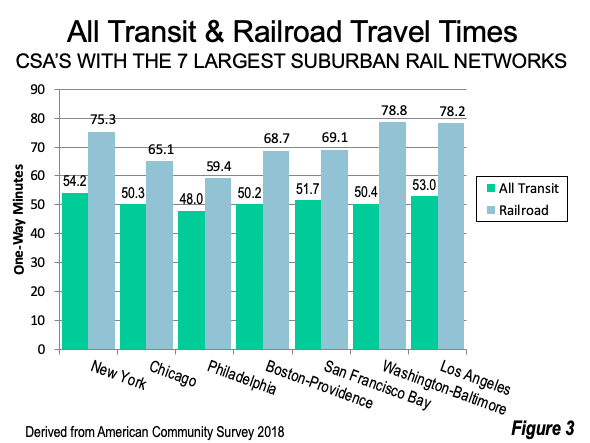
Suburban rail travel times are extraordinarily long. The average one-way commute is 71 minutes, nearly 20 minutes longer than the average transit commute. Suburban rail comes closest to matching average transit times in Philadelphia, where its riders spend about 11 minutes longer traveling each way. Suburban rail trips are 28 minutes longer in Washington-Baltimore and 25 minutes longer in Los Angeles (Figure 3).
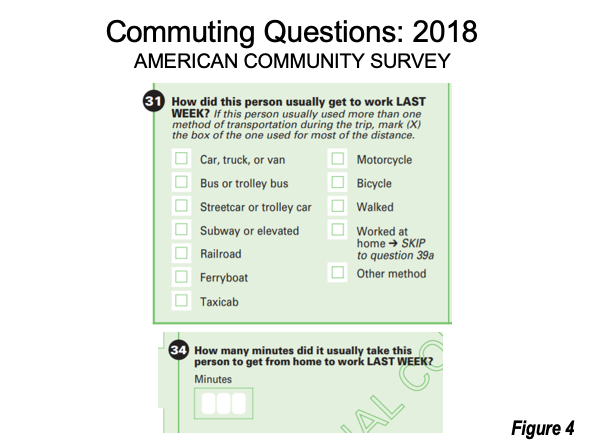
This is indicated by American Community Survey (ACS) commuting data for 2018. ACS asks for information on how people commute to work (Figure 4). The 2018 question (#31) was “How did this person usually get to work LAST WEEK?” with this clarification “If this person usually used more than one method of transportation during the trip, mark (X) the box of the one used for most of the distance. Question #31 asks: “How many minutes did it usually take this person to get from home to work LAST WEEK?”
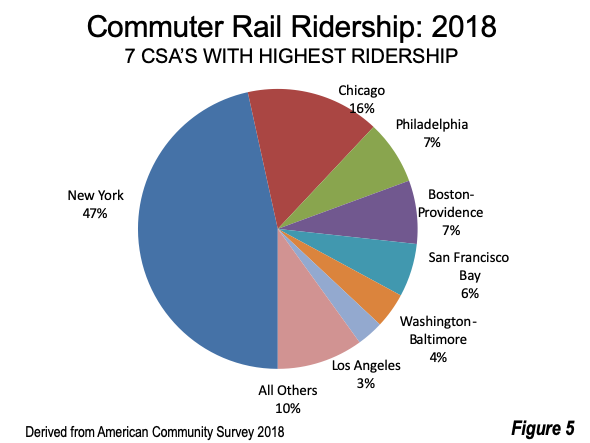
This article reviews work trip travel times for the “railroad” mode in the CSA’s with the seven largest networks in the United States (Note). The larger labor markets that comprise CSA’s are used because the railroad networks are not confined to the core metropolitan areas. The largest suburban rail network is in New York, which carried 460,000 daily one-way commuters on three systems (Long Island Rail Road, Metro-North Railroad and New Jersey Transit). The smallest network, in Los Angeles carried 30,000 one-way commuters daily (Figure 5).
Comparing Suburban rail to All Transit Modes
The seven CSAs also the largest number of transit commuters, as well and the largest transit systems. They include the transit “legacy” cities of New York, Chicago, Philadelphia, Boston, San Francisco and Washington, as well as Los Angeles. These CSAs have the most comprehensive transit systems in the nation. Yet, the average one-way commute time is more than two-thirds greater than that of driving alone (51.0 minutes on transit and 30.2 minutes driving alone).
Comparing Suburban Rail to Driving Alone
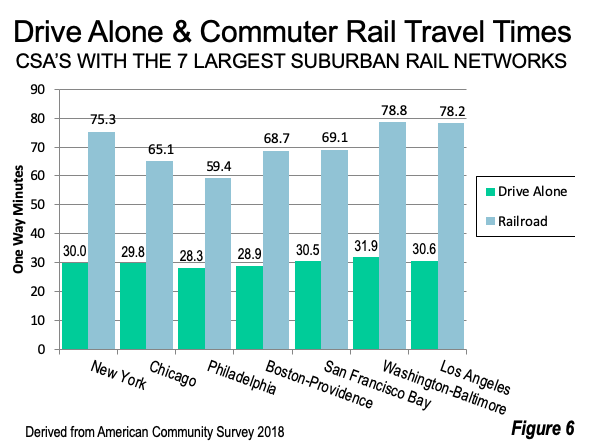
Commuter rail riders have one-way trips that average 2.3 times that of those who drive alone in the seven CSA’s. Suburban rail commutes in Philadelphia compare best to driving alone, at just more than double (30 minutes more). Suburban rail riders have average trips 2.5 times as long as driving alone in New York, Washington-Baltimore and Los Angeles (Figure 6). Assuming travel to work and back home, the average suburban rail commuter in New York commutes for 90 more minutes than the average solo driver. The difference is even greater in Washington-Baltimore (94 minutes) and Los Angeles (96 minutes).
Most Long - Suffering Commuters
The longest suburban rail commutes, by county are shown below:
- Harford County, Maryland (Washington-Baltimore CSA) report the longest suburban rail commutes, at 107.3 minutes. This is 3.4 times the average commute of Harford County residents driving alone.
- Orange County, New York has the longest suburban rail commutes in the New York CSA, at 106.8 minutes. This is 3.3 times that of the average Orange County commuter who drives alone.
- San Joaquin County, California suburban rail commuters spend an average of 106.1 minutes traveling to work, the longest in the San Francisco Bay CSA. This is 3.1 times that average commute time for San Joaquin County residents driving alone.
- Kenosha County, Wisconsin suburban rail commuters travel the longest in the Chicago CSA, at 106.1 minutes. This is 3.7 times than average commute time for fellow county residents driving alone.
- San Bernardino County, California suburban rail commuters travel the longest in the Los Angeles CSA, at 94.8 minutes. This is 3.1 times the average commute time for fellow residents driving alone.
- Providence County, Rhode Island County suburban rail commuters travel the longest in the Boston-Providence CSA, at 86.2 minutes. This is 3.6 times than the average commute time for fellow residents driving alone.
- Bucks County, Pennsylvania suburban rail commuters travel the longest in the Philadelphia CSA, at 84.4 minutes --- 2.8 times the 29.7 minutes of Bucks residents who drive alone.
Where Suburban Rail Reigns: New York
As Figure 5 (above) indicates, nearly one-half of the nation’s suburban rail ridership is in New York. The top five counties with the largest number of suburban rail commuters are in New York, and seven of the top 10 (Figure 7):
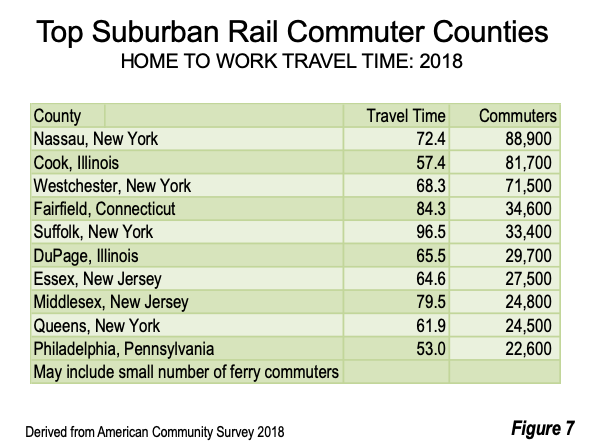
- Nassau County, New York (located on New York’s Long Island Rail Road) has the largest number of suburban rail commuters, at 88,900 daily and has an average commute time of 72.4 minutes. This is 2.4 times the travel time of drive alone commuters. Suffolk County is also on the Long Island, with the fifth most suburban rail commuters, but the longest travel time among the strongest 10 counties, at 96.5 minutes. Queens County, ranked 9th, is also on the Long Island.
- Westchester County, New York, is served by the Metro North Railroad and has the third highest number of suburban rail commuters, at 81,700 daily and a travel time of 68.3 minutes. Across the Connecticut border, Fairfield County ranks fourth in daily suburban rail commuters, with a travel time of 84.3 minutes.
- Essex County, New Jersey, served by New Jersey Transit (NJT) ranks 7th, with a travel time of 64.6 minutes. Middlesex County, New Jersey also has NJT service and ranks 8th with a travel time of 79.5 minutes
Impact of Covid-19 on Suburban Rail
During the Covid-19 pandemic, there has been a massive increase in remote working.
This is most evident in New York, where the New York Metropolitan Transportation Authority (MTA) reports weekday ridership down on the Long Island Rail Road 79% and on Metro-North Railroad 83% from typical levels.
Much has been written about the large increase in working at home during the pandemic and the likelihood that a portion of this increase could be retained after the health threat passes. A permanent increase seems likely among New York suburban rail commuters. Regardless of how they previously traveled, many other commuters around the country have found working at home preferable to the crowded trains and crowded highways that may have needlessly consumed so much of their time.
Note: The American Community Survey does not differentiate between “railroad” and “ferry boat” travel times. Most of these commuters are on suburban rail systems.
Wendell Cox is principal of Demographia, an international public policy firm located in the St. Louis metropolitan area. He is a founding senior fellow at the Urban Reform Institute, Houston and a member of the Advisory Board of the Center for Demographics and Policy at Chapman University in Orange, California. He has served as a visiting professor at the Conservatoire National des Arts et Metiers in Paris. His principal interests are economics, poverty alleviation, demographics, urban policy and transport. He is co-author of the annual Demographia International Housing Affordability Survey and author of Demographia World Urban Areas.
Mayor Tom Bradley appointed him to three terms on the Los Angeles County Transportation Commission (1977-1985) and Speaker of the House Newt Gingrich appointed him to the Amtrak Reform Council, to complete the unexpired term of New Jersey Governor Christine Todd Whitman (1999-2002). He is author of War on the Dream: How Anti-Sprawl Policy Threatens the Quality of Life and Toward More Prosperous Cities: A Framing Essay on Urban Areas, Transport, Planning and the Dimensions of Sustainability.
Photograph: Approaching the Hudson River Tunnel in New Jersey toward New York’s Penn Station (by author).


Rail vs driving alone
It's probably not entirely fair to compare rail transit times with driving alone, since they're likely not going to the same destination. E.g., folks riding the rails from Dutchess County, NY, are nearly all working in Manhattan, which is 60+ miles away. Those driving alone are likely working in Dutchess, Westchester or Orange, all of which are much closer.
The proper comparison would be rail times to Wall St. vs drive times to Wall St. I think rail likely will win that contest (at least pre-Covid).