Earlier this month (May 9, 2016) the Orange County (California) Grand Jury issued a report entitled: “Light Rail: Is Orange County on the Right Track,” which is on the Grand Jury website here. The report largely concludes that it is not and that there is a need for a light rail system in Orange County. On page 7, the 2016 Grand Jury report says: “No Grand Jury has reported on development of light rail systems in Orange County.”
In fact, there was a previous report, at: http://www.ocgrandjury.org/pdfs/GJLtRail.pdf, which is a 1999 report of the Orange County Grand Jury entitled: “Orange County Transportation Authority and Light Rail Planning.” Both the 1999 and 2016 reports are on the Orange County Grand Jury website as of May 25, 2016. The 1999 report reached fundamentally different conclusions than the 2016 report. Obviously, the 2016 report makes no attempt to reconcile its findings or analysis with the 1999 report.
Inappropriate Density Comparison
There are additional problems with the 2016 Grand Jury Report. In making the case for light rail in Orange County, the 2016 Grand Jury put considerable emphasis on the fact that Orange County’s population density is higher than that of Los Angeles County. The reason for Orange County’s population density advantage is the fact that much of Los Angeles County is in the largely undevelopable Transverse Ranges (including the San Gabriel Mountains), with a considerable amount of rural (not urban) desert. The difference is that Orange County’s land area is approximately two-thirds urban, while Los Angeles County’s land area is about one-third urban. This renders the overall density comparison for urban transportation planning meaningless.
Indeed, the urban density of Los Angeles County is substantially higher than that of Orange County. According to the United States Census Bureau, the population density of the urban areas in Los Angeles County was 6,859 per square mile in 2010, well above Orange County’s 5,738. Los Angeles County’s densest census tract is nearly 2.5 times the density of any census tract in Orange County.
Transit is About Downtown
Even so, urban rail ridership bears little relationship to overall urban population density (otherwise the San Jose urban area would be a better environment for rail than the New York urban area). In 2010, San Jose’s density was about 5,820, while New York’s was 5,319 (Los Angeles was 6,999, including the most dense parts of Los Angeles and Orange County and part of San Bernardino County).
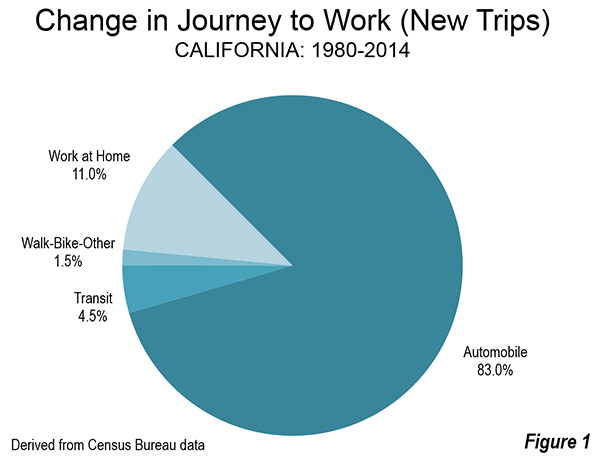
One of the most important keys to transit ridership is the concentration of work destinations in a dense central business district (CBD), to which nearly all high capacity and frequent transit services converge. In the United States, 55 percent of all transit commuting destinations are in the six largest municipalities (such as the city of New York or the city of San Francisco, as opposed to metropolitan areas) with the largest central business districts. This is dominated by New York with about 2,000,000 employees in its CBD. On the other hand, San Jose has one of the smallest central business districts of any major metropolitan area and a correspondingly smaller transit market share than the national average. Orange County, with an urban form far more like San Jose than New York or San Francisco, has little potential to materially increase transit ridership with light rail.
The record of new urban rail in the United States is less than stellar, evaluated on the most important metric. Generally, new urban rail has resulted in only minor increases in transit’s miniscule market share and in some cases there have been declines.
In the case of Los Angeles, on which the Grand Jury relies for its conclusion favoring light rail development, three one-half cent sales taxes and spending that has amounted to more than $16 billion on development of new rail lines. Yet, transit ridership has fallen, as reported in the Los Angeles Times (see: “Just How Much has Los Angeles Transit Ridership Fallen”). Former SCRTD (predecessor to the MTA) Chief Financial Officer Thomas A. Rubin has also suggested that the MTA ridership decline may be greater if adjusted for the increased number of transfers that have occurred in the bus-rail system compared to the previous bus system (For example, a person traveling from home to work who starts on a bus, transfers to rail and finished the trip on a bus, counts as three, not one).
Required Responses:
The Grand Jury report notes:
“The California Penal Code Section 933 requires the governing body of any public agency which the Grand Jury has reviewed, and about which it has issued a final report, to comment to the Presiding Judge of the Superior Court on the findings and recommendations pertaining to matters under the control of the governing body. Such comment shall be made no later than 90 days after the Grand Jury publishes its report (filed with the Clerk of the Court).”
This would apparently require a response by August 9, 2016
Permission Granted to Cite or Quote this Article or the Linked Documents
Any respondent is hereby granted permission to cite or quote from this article or the linked documents.