
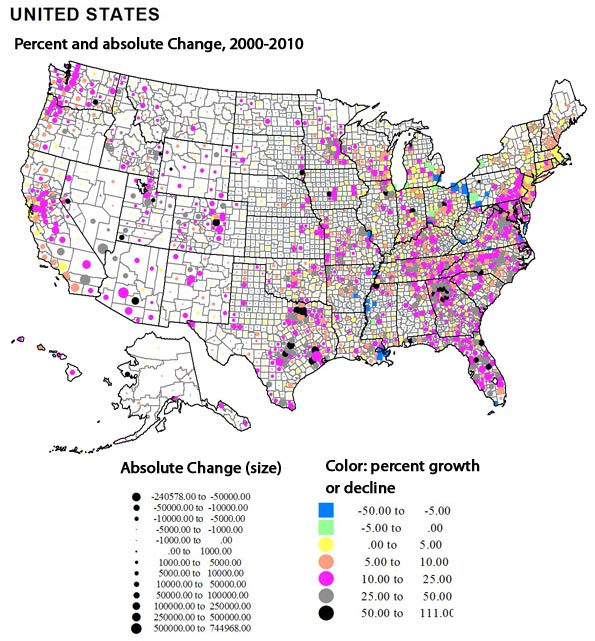
Dramatic shifts in population growth across the United States in the last decade should surprise no one. Some patterns are continuing trends of earlier decades, but other patterns show substantial change. I show these changes in three ways, first a conventional choropleth map coloring counties by broad classes from high losses to moderate and high percent gain, second a map in which absolute gains and losses are depicted by proportional symbols, with colors showing the rate of change, and third, a look a counties that experienced either extreme loss and gain.
There are four major regions that experienced population loss. The largest covers the rural high plains from Texas to Canada, and most marked in Kansas, Nebraska, Iowa, North and South Dakota, and eastern Montana in a continuation of at least 60 years, and no surprise, as farms get larger and more mechanized, small towns decline. Yet these losses are less pervasive than earlier, especially due to energy development in Wyoming, North and South Dakota and Montana, and energy and agricultural change in Oklahoma and Texas.
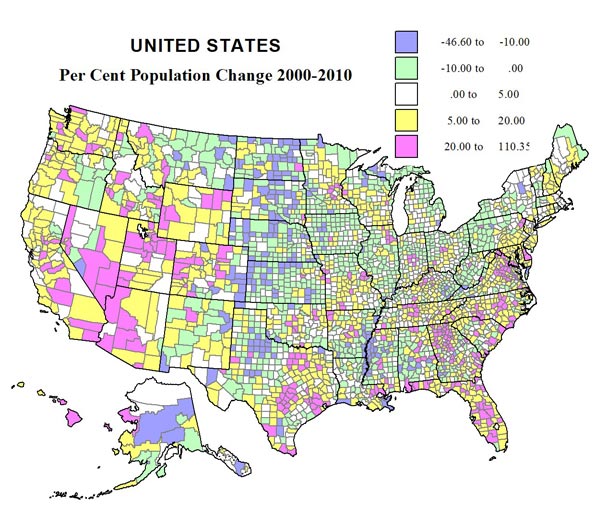
The second area of decline, also continuing a long historic trend, can be seen in the heavily African-American dominated areas in the Mississippi Delta, in Arkansas, Louisiana and Mississippi, and across the Black belt, Alabama, Georgia, and South Carolina, where significant development investment simply did not occur—race matters.
Third, we see continued population reductions across Appalachia from eastern Kentucky, through West Virginia, but this loss has now taken gotten more severe in western Pennsylvania and New York, largely due reductions in mining and manufacturing as well as a dearth of new investment.
Fourth is decline across many urban as well as rural counties in the upper Midwest, in Illinois, Indiana, Ohio and Michigan, due to a complex mix of deindustrialization and related forces.
Looking at losses from the map emphasizing absolute number of population change reduces the significance of the losses in the Plains, as most were small, reveals somewhat larger absolute losses in the Mississippi delta, and the specific Katrina-led losses in greater New Orleans. It highlights the concentration of larger losses in core metropolitan counties, not only in northern Appalachia and the upper Midwest, particularly in Ohio, Pennsylvania and Michigan, but also in other large cities, as St. Louis and Chicago.
At least eight regions of significant growth can be described. Territorially, the most obvious can be seen in the Mountain stares, from Arizona, through Utah and much of Colorado, Wyoming into parts of Idaho and Montana. The reasons vary, from energy in Wyoming, to more amenity based growth in western Colorado and Montana, to broader, across the board expansions in Arizona, Utah and Idaho. The high fertility in the Mormon realm also played a role. Nevada is, well, Nevada.
A second area of continuing growth is across the Pacific coast, but especially the entire I-5 corridor, the spillover counties surrounding Los Angeles, California’s Central valley, largely due to high Latino growth (which was a major factor way to the north in Washington state).
Third is the continuing and large scale boom in and around the largest Texas cities, Dallas, Houston, Austin and San Antonio. All have enjoyed a combination of population and economic growth.
Fourth is a pickup in growth from Oklahoma across the Ozarks, through northwestern Arkansas and across southern Missouri, from a mixture of industrial development and amenity migration.
Fifth is a less expected belt of growth from the Chicago suburbs, across western Wisconsin, and Minnesota (especially northern), to Fargo, ND.
Sixth is the never ending growth of Florida. Seventh is the continuing significant urban and industrial based growth in the middle South, from Tennessee and Kentucky, northern Georgia, through South and North Carolina, into Virginia. Then, eighth, is the high level of growth over what we might call the outer, exurban edges of Megalopolis, from Richmond, Virginia, to southern Maine.
Looking at absolute gains from the second map shows a quite widespread geography of growth, many micropolitan and small metropolitan counties across the west registered the highest rates of gain. Similarly across the Plains, while the greatest growth is in suburban counties around the Texas giants, growth was robust in many smaller metropolitan areas and cities, from the Mexican border up to Canada. Likewise, in the upper Midwest, despite problem in the declining big city cores, growth was stronger in exurban and small metropolitan areas. Across the southeast, despite the stupendous growth around Atlanta, Nashville, Raleigh and Washington DC, the significant pattern is how widespread growth was across much of the region. Florida, too, perhaps grew less fast in its long time biggest cities, but is now filling up the remaining space!
Finally Megalapolis is far from dormant. The old cores of Baltimore, Philadelphia, New York and Boston may be slow growing or even declining a little,but the satellite and exurban belt show remarkable gains, especially in Maryland, Delaware and eastern Pennsylvania, in a kind of spillover of investment and residence to its outer limits.
The Biggest Losers and Gainers
Absolute losses: The largest loss numbers are in core counties of de-industrializing metropolitan areas in the north. Among just the 21 counties losing more than 10,000, Michigan has 3 for a loss of 260,000, Ohio, 6, for a loss of 228,000, and Pennsylvania 3, for a loss of 81,000. Others include Cook county (Chicago), St Louis city and county, Erie (Buffalo), and Baltimore. Greater New Orleans includes three counties, with a loss of 195,000. The one non-metropolitan county is highly African-American Washington County, MS (Greenville). Indeed, high Black concentration is a common denominator among all these areas. Race continues to rule demography in much of the south.
Relative losses: Most of the counties with the highest loss rate (48 counties with over a 17 percent loss) are rural or small town. The only exceptions are Orleans and St. Bernard (New Orleans). States with high rate loss counties include Texas (7), Mississippi and North Dakota (6), Louisiana (5) Arkansas and Kansas (4), South Dakota, Nebraska, Montana and Alaska (2), and one each in Colorado, Minnesota, Nevada, New Mexico, Oklahoma and West Virginia. The AR, LA and MS counties are heavily African American.
Absolute Gains
51 counties gained more than 100,000 residents. The top 11 are
Wake, NC :: 273,000
San Diego :: 281,000
Collin, TX (Dallas suburb) :: 291,000
Los Angeles :: 299,000
Bexar (San Antonio :: 322,000
San Bernardino :: 326,000
Tarrant (Ft. Worth) :: 363,000
Clark, NV (Las Vegas) :: 576,000
Riverside :: 644,000
Harris (Houston) :: 692,000
Maricopa (Phoenix) :: 745,000
Of the 51 big gainers, ALL are metropolitan, as the 12 in Texas gained 3,171,000, the 12 in California 2,640,000, 7 in Florida 1,335,000, two in North Carolina 497,000, three in Virginia 384,000, and two in Georgia 332000. Many of these counties are Sunbelt core counties, or satellite or spillover counties. Many are suburbs of large metropolitan centers. Of the 51, only 8 are in the “north” of the country (Illinois, Utah, Washington and northern California).
Relative Gains
The eight counties gaining more than 75% are
Sumter, FL :: 75%
Forsyth GA :: 78
Rockwall, TX :: 82
Loudon, VA :: 84
Lincoln, WY :: 86
Flagler, FL :: 92
Pinal, AZ :: 109
Kendall, IL :: 110
Of the top 35 counties, gaining over 50 percent, Texas had seven, Georgia, six, Florida four, Utah 2, with one each in AK, AZ, CO,ID, IL, IN, IA, MS, NV,NC, OH, PA, SD, VA, WA and WY. Twenty-eight are metropolitan suburbs, three are new small metropolitan areas (FL UT), two are energy development areas (SD, WY) and two more environmental (PA, ID). Finally of the 35, 11 are in the North, 24 in the South. Eight counties are in both the highest absolute and highest relative lists—Pinal, AZ, Douglas, CO, Loudon, VA, and five in Texas, Collin, Denton, Montgomery, Ft. Bend, and Williamson. Overall, in terms of growth, Texas wins.
Conclusion
I know a lot about population in the US, but still I’m glad I didn’t venture predictions ten years ago, as population change is more than a little unpredictable. Yes, Sunbelt growth was expected, but the details were sometimes as expected but there were unusual gains and losses. The data reviewed here are just the totals for redistricting, so no attempt was made to relate population change to economic change. Still, while some of the redistribution to the Sunbelt, or to the Mountain states was amenity or retirement driven, much more seems to be a consequence of massive shifts of industry and services from the higher cost north to the lower cost south. But there is a vast amount of talent and physical plant in these areas so I would not dare to predict that 2020 would be a simple continuation of the last decade.
Richard Morrill is Professor Emeritus of Geography and Environmental Studies, University of Washington. His research interests include: political geography (voting behavior, redistricting, local governance), population/demography/settlement/migration, urban geography and planning, urban transportation (i.e., old fashioned generalist).


Superb
Third is the continuing and extensive growth in and around the biggest Florida places, Facilities, Austin, tx, Austin, tx and San Antonio. All have experienced a mixture of population and economic growth.
bankingbasics.net
very good
very nice site i like it ......penguin seo update