
A new Brookings Institution report provides an unprecedented glimpse into the lack of potential for transit to make a more meaningful contribution to mobility in the nation's metropolitan areas. The report, entitled Missed Opportunity: Transit and Jobs in Metropolitan America, provides estimates of the percentage of jobs that can be accessed by transit in 45, 60 or 90 minutes, one-way, by residents of the 100 largest US metropolitan areas. The report is unusual in not evaluating the performance of metropolitan transit systems, but rather, as co-author Alan Berube put it, "what they are capable of." Moreover, the Brookings access indicators go well beyond analyses that presume having a bus or rail stop nearby is enough, missing the point the availability of transit does not mean that it can take you where you need to go in a reasonable period of time.
Transit: Generally Not Accessible: It may come as a surprise that, according to Brookings, only seven percent of jobs in the nation's largest metropolitan areas can be reached by residents in 45 minutes during the morning peak period (when transit service is the most intense). Among the 29 metropolitan areas with more than 2,000,000 population, the 45 minute job access average was 5.6 percent, ranging from 12.6 percent in Boston to 1.3 percent in Riverside-San Bernardino. The New York's metropolitan area's 45 minute job access figure was 9.8 percent (Figure 1).
![]()
Brookings did not examine a 30 minute transit work trip time. However, a bit of triangulation (Note 1) suggests that the 30 minute access figure would be in the range of 3 to 4 percent, at most about 4,000,000 jobs out of the more than 100 million in these metropolitan areas. At least 96 percent of jobs in the largest metropolitan areas would be inaccessible by transit in 30 minutes for the average resident (Figure 2).
![]()
The Brookings report also indicates that indicates that 13 percent of employment is accessible within 60 minutes by transit and 30 percent within 90 minutes (Note 2). Brookings focuses principally on the 90 minutes job accessibility data. However, the reality is that few people desire a 45 minute commute, much less one of 90 minutes.
In 2009, in fact, the median one way work trip travel time in the United States was 21 minutes (Note 3). Approximately 68 percent of non-transit commuters (principally driving alone, but also car pools, working at home, walking, bicycles, taxicabs and other modes) were able to reach work in less than 30 minutes. The overwhelming majority, 87 percent, were able to reach work in 45 minutes or less, many times transit's seven percent. Transit's overall median work trip travel time was more than double that of driving alone (Figure 3).
![]()
A mode of transport incapable of accessing 96 percent of jobs within a normal commute period simply does not meet the needs of most people. This makes somewhat dubious claims that transit can materially reduce congestion or congestion costs throughout metropolitan areas. The Brookings estimates simply confirm the reality that has been evident in US Census Bureau and US Department of Transportation surveys for decades: that transit is generally not time-competitive with the automobile. It is no wonder that the vast majority of commuters in the United States (and even in Europe) travel to work by car.
Much of the reason for transit's diminished effectiveness lies in the fact that downtowns --- the usual destination for transit --- represent a small share of overall employment. Downtown areas have only 10 percent of urban area employment, yet account for nearly 50 percent of transit commuting in the nation's largest urban areas (Figure 4).
![]()
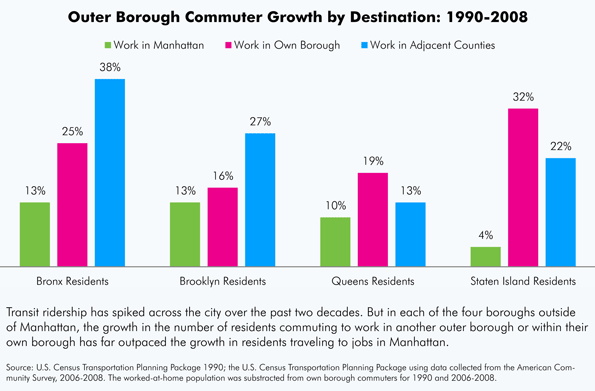
Meanwhile, core areas, including downtown areas, represent a decreasing share of the employment market as employment dispersion has continued. Since 2001, metropolitan areas as different as Philadelphia, Portland, Dallas-Fort Worth, Salt Lake City, Denver and St. Louis, saw suburban areas gain employment share. Even in the city of New York, outer borough residents are commuting more to places other than the Manhattan central business district (link to chart).
Transit: The Long Road Home: Transit problem stems largely from its relative inconvenience. In 2009, 35 percent of transit commuters had work trips of more than 60 minutes. Only six percent of drivers had one way commutes of more than 60 minutes. For all of the media obsession about long commutes, more than twice as many drivers got to work in less than 10 minutes than the number who took more than an hour. In the case of transit, more than 25 times as many commuters took more than 60 minutes to get to work as those who took less than 10 minutes.
Economists Peter Gordon and Harry W. Richardson have shown that the continuing dispersion of jobs (along with residences) has kept traffic congestion under control in the United States. Available data indicates that work trips in the United States generally take less time than in similar sized urban areas in Europe, Japan, Canada and Australia.
Transit Access is Better for Low Income Citizens: The Brookings report also indicated that job accessibility was better for low income citizens than for the populace in general. Approximately 36 percent of jobs were accessible to low-income residents in 90 minutes, compared to the overall average of 30 minutes. This, of course, is because low income citizens are more concentrated in the central areas of metropolitan areas where transit service is better. But even this may be changing. For example, Portland’s aggressive gentrification and transit-oriented development programs are leading to lower income citizens, especially African-Americans, being forced out of better served areas in the core to more dispersed areas where there is less transit. Nikole Hannah Jones of The Oregonian noted:
"And those who left didn't move to nicer areas. Pushed out by gentrification, most settled on the city's eastern edges, according to the census data, where the sidewalks, grocery stores and parks grow sparse, and access to public transit is limited."
Realistic Expectations: More money cannot significantly increase transit access to jobs. Since 1980, transit spending (inflation adjusted) has risen five times as fast as transit ridership. A modest goal of doubling 30 minute job access to between 6 and 8 percent would require much more than double the $50 billion being spent on transit today.
Moreover, there is no point to pretending that traffic will get so bad that people will abandon their cars for transit (they haven't anywhere) or that high gas prices will force people to switch to transit. No one switches to transit for trips to places transit doesn't go or where it takes too long.
Nonetheless, transit performs an important niche role for commuters to some of the nation's largest downtown areas, such in New York, Chicago, Boston, San Francisco, and Philadelphia. Approximately half or more of commuters to these downtowns travel there by transit and they account for nearly 40 percent of all transit commuters in the 50 largest urban areas.
Yet for 90 percent of employment outside downtown areas, transit is generally not the answer, and it cannot be made to be for any conceivable amount of money. If it were otherwise, comprehensive visions would already have been advanced to make transit competitive with cars across most of, not just a small part of metropolitan areas.
All of this is particularly important in light of the connection between economic growth and minimizing the time required to travel to jobs throughout the metropolitan area.
The new transit job access is important information for a Congress, elected officials, and a political system seeking ways out of an unprecedented fiscal crisis.
A four percent solution may solve 4 percent of the problem, but is incapable of solving the much larger 96 percent.
Notes:
1. For example at difference between transit commuters reaching work in less than 30 minutes and 45 minutes, Brookings employment access estimate of 7 percent at 45 minutes would become 3 percent at 30 minutes.
2. The Brookings travel time assumptions appear to be generally consistent with data from the Census Bureau's American Community Survey (ACS) and the US Department of Transportation's National Household Transportation Survey (NHTS). Brookings, ACS includes the time spent walking to transit in work trip travel times (For example, the ACS questionnaire asks respondents how long it takes to get from home to work and thus includes the time necessary to walk to transit).
3. Median travel times are estimated from American Community Survey data for 2009 and includes working at home. The "median" is the point at which one half of commuters take more time and one-half of commuters take less time to reach work and is different from the more frequently cited "average" travel time, which was 25.5 minutes in 2008.
4. Is Transit Better in Smaller Metropolitan Areas? It is generally assumed that transit service is better in larger metropolitan areas than in smaller metropolitan areas. Yet, the Brookings data seems to indicate the opposite. Larger metropolitan areas tended to have less job access by transit than smaller metropolitan areas. In the largest 20 percent (quintile) of metropolitan areas, only 5.5 percent of employment was accessible within 45 minutes. This was the smallest quintile accessibility score, and well below the middle quintile at 9.2 percent and the bottom quintile at 8.3 percent. The top quintile included metropolitan areas with 2.6 million or more people, the middle quintile included metropolitan areas with 825,000 to 1,275,000 population and the bottom quintile included metropolitan areas between 500,000 and 640,000 (Figure 1). This stronger showing by smaller metropolitan areas probably occurs because it is far less expensive for transit to serve a smaller area. Further, smaller metropolitan areas can have more concentration in core employment. Even so, smaller metropolitan areas tend to have considerably smaller transit market shares than larger metropolitan areas.
Wendell Cox is a Visiting Professor, Conservatoire National des Arts et Metiers, Paris and the author of “War on the Dream: How Anti-Sprawl Policy Threatens the Quality of Life”
Photo: Suburban employment: St. Louis (by author)


Evidence of The Costs of Automobile Dependency and Sprawl
This analysis indicates the severe problems that automobile dependency and sprawl impose on people who for any reason cannot drive. This is unfair and inefficient since it reduces economic opportunities to disadvantaged people, and it imposes indirect costs such as forcing motorists to chauffeur non-driving relatives and friends.
The inadequacy of public transit services result from transport and land use policies that favor investments in roads and parking facilities over transit improvements, and encouraged dispersed, urban-fringe development. Total current transit expenditures (capital and operating) in the U.S. average about $175 annually per capita, which is small compared with about $500 spent on roads, $2,000 spent on parking facilities, and $5,000 spent on vehicles and fuel. Similarly, development policies such as generous minimum parking requirements encourage sprawl and subsidize driving.
Much can be done to improve public transit speeds and efficiencies through grade separation, transit-priority at intersections, prepaid fare payment systems, increased service frequency, and land use policies that support more transit-oriented development. Since transit service experiences scale economies (increased ridership reduces costs per passenger-mile decline) policies that encourage transit ridership tend to improve service overall. For example, efficient road and parking pricing, and transit oriented commercial development, encourage more commuters to use public transit which leads to more frequent service and more routes.
Demand for transit is increasing. In every community a portion of people cannot drive or afford an automobile, and this is projected to increase due to aging population, rising fuel pricing and traffic safety policies that discourage driving by teenagers, alcohol drinkers and mobile telephone users. Many commuters prefer using public transit provided it is reasonably convenient and comfortable, even if it takes somewhat longer, because they can relax, read or work while traveling. In addition, much of the time premium for public transit travel consists of time spent walking or cycling to stops and stations which provides health benefits. In fact, on average transit commuters achieve the U.S. Center for Disease Control's target of at least 22 daily minutes of moderate physical activity, due to this additional walking, while automobile commuters on average do not.
The Brookings Institute report and this blog highlight the importance of transport and land use policy reforms to create a transportation system that serves the needs of all residents, not just motorists.
For More Information
Lilah M. Besser and Andrew L. Dannenberg (2005), “Walking to Public Transit: Steps to Help Meet Physical Activity Recommendations,” American Journal of Preventive Medicine, Vo. 29, No. 4 (www.acpm.org); at www.cdc.gov/healthyplaces/articles/besser_dannenberg.pdf.
CTS (2010), How Light-Rail Transit Improves Job Access for Low-Wage Workers: A Transitway Impacts Research Program (TIRP) Research Brief, Center for Transportation Studies, University of Minnesota (www.cts.umn.edu); at www.cts.umn.edu/Research/Featured/Transitways/documents/lowincome.pdf.
Kevin Krizek, Ahmed El-Geneidy, Michael Iacono and Jessica Horning (2007), Access to Destinations: Refining Methods for Calculating Non-Auto Travel Times, Report No. 2,
Access to Destinations Study, University of Minnesota's Center for Transportation Studies (www.cts.umn.edu/access-study/publications).
Ugo Lachapelle, et al. (2011), “Commuting by Public Transit and Physical Activity: Where You Live, Where You Work, and How You Get There,” Journal of Physical Activity and Health, Vol. 8, Supplement 1, pp. S72-S82; at http://journals.humankinetics.com/JPAH-supplements-special-issues/jpah-v....
Todd Litman (2010), Raise My Taxes, Please! Evaluating Household Savings From High Quality Public Transit Service, Victoria Transport Policy Institute (www.vtpi.org); at www.vtpi.org/raisetaxes.pdf.
Reconnecting America (2004), Hidden In Plain Sight: Capturing The Demand For Housing Near Transit, Center for Transit-Oriented Development for the Federal Transit Administration; at www.reconnectingamerica.org/pdfs/Ctod_report.pdf.
Todd Litman is founder and executive director of the Victoria Transport Policy Institute (www.vtpi.org), an independent research organization dedicated to developing innovative solutions to transport problems.