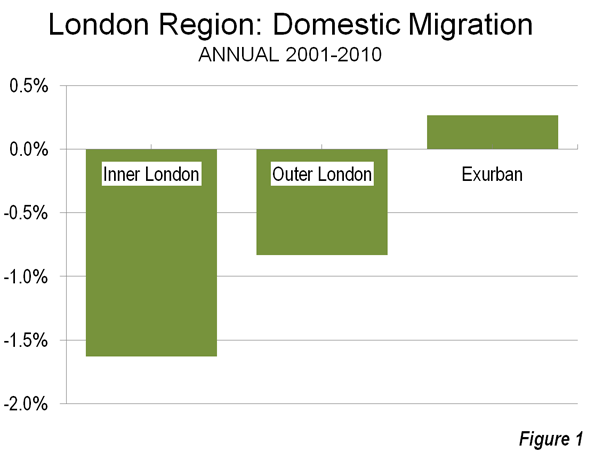
As reported in The Evolving Urban Form: London, last July the Greater London Authority (GLA), located inside the Green Belt, grew strongly from 2001 to 2011, though remains well below its peak estimated population in 1939. Substantial domestic migration from the core area to the exurbs was a major contributor to their growth during between 2000 and 2010 (Figure 1).
Obviously, with all that growth and all that domestic out-migration, international migration had to be driving the population growth in the GLA. The British Broadcasting Corportation (BBC) confirms that, reporting that, for the first time "white British" residents of GLA represent a minority of the population. At 45 percent, this population segment is down from 58 percent in 2011.
Whites, however, remain a majority, with more than 1.3 who do not consider themselves British, according to the 2011 census data. The combined white population is nearly 60 percent of the GLA total. The table below provides the ethnic data as reported by the Office for National Statistics.
| Greater London Authority: Ethnicity | ||
| 2011 Census | ||
| All categories: Ethnic group | 8,173,941 | 100.0% |
| White: English/Welsh/Scottish/Northern Irish/British | 3,669,284 | 44.9% |
| White: Irish | 175,974 | 2.2% |
| White: Gypsy or Irish Traveller | 8,196 | 0.1% |
| White: Other White | 1,033,981 | 12.6% |
| Mixed/multiple ethnic group: White and Black Caribbean | 119,425 | 1.5% |
| Mixed/multiple ethnic group: White and Black African | 65,479 | 0.8% |
| Mixed/multiple ethnic group: White and Asian | 101,500 | 1.2% |
| Mixed/multiple ethnic group: Other Mixed | 118,875 | 1.5% |
| Asian/Asian British: Indian | 542,857 | 6.6% |
| Asian/Asian British: Pakistani | 223,797 | 2.7% |
| Asian/Asian British: Bangladeshi | 222,127 | 2.7% |
| Asian/Asian British: Chinese | 124,250 | 1.5% |
| Asian/Asian British: Other Asian | 398,515 | 4.9% |
| Black/African/Caribbean/Black British: African | 573,931 | 7.0% |
| Black/African/Caribbean/Black British: Caribbean | 344,597 | 4.2% |
| Black/African/Caribbean/Black British: Other Black | 170,112 | 2.1% |
| Other ethnic group: Arab | 106,020 | 1.3% |
| Other ethnic group: Any other ethnic group | 175,021 | 2.1% |
| Source: Office for National Statistics, United Kingdom |


I am very happy to read this
I am very happy to read this article. Thanks for giving us go through info.Fantastic nice. I appreciate this post.obat pelangsing badan * obat peninggi badan * obat penghilang tatto * obat peninggi badan
This is a great inspiring
This is a great inspiring article.I am pretty much pleased with your good work.You put really helpful information. Keep it up.perontok bulu permanen * body slim herbal * grosir kosmetik * cctv murah * jual cctv * jual acrylic
. The table below provides
. The table below provides the ethnic data as reported by the Office for National Statistics. obat pelangsing
Hmm… I read blogs on a
Hmm… I read blogs on a similar topic, but i never visited your blog. I added it to favorites and i’ll be your constant reader.
What Men Secretly Want Review
"This is just the
"This is just the information I am finding everywhere. Thanks for your blog, I just subscribe your blog. This is a nice blog. "
wordpress directory theme
I thought it was going to be
I thought it was going to be some boring old post, but it really compensated for my time. I will post a link to this page on my blog. I am sure my visitors will find that very useful.
http://exbackreviews.com
This is such a great
This is such a great resource that you are providing and you give it away for free. I love seeing websites that understand the value of providing a quality resource for free. It is the old what goes around comes around routine.
be the man every woman wants
Thanks for writing such a
Thanks for writing such a good article, I stumbled onto your blog and read a few post. I like your style of writing...
Terracotta warriors
I’m so happy to read this.
I’m so happy to read this. This is the kind of manual that needs to be given and not the accidental misinformation that’s at the other blogs. Appreciate your sharing this best doc.
Edward Bass Producer
Domestic migration i think
Domestic migration i think it increasing as compare to last previous years. Are women ratio also increasing
boost your bust