
We cannot escape the reality of a polarized America, given the current level of rhetorical and real political gridlock. And maps are frequently invoked to illustrate that this polarization is also geographic, with clear-cut Red and Blue territories.
Clearly there are large areas of extreme polarization, and we will show them. But there are also more balanced kinds of counties which vote not consistently with one side. These contested areas are more extensive than people likely believe or the media proclaim. This is healthy for the nation.
I employed a cluster analysis of US counties with selected variables that do best at distinguish voting Democratic or Republican. This produced a useful 10 cluster solution, based most critically on voting Red or Blue, but also taking into account kinds of settlement, i.e metropolitan, small city, and rural, and a cultural gradation from traditional religious conservative to socially progressive. The historic scale on economic distinctions between Democrat and Republican is virtually extinct.
Five clusters exhibit extreme spatial polarization—three highly Republican, two strongly Democratic. Two are solid Republican but not extreme. Three are balanced, so much so that counties in each voted Republican and Democratic, so we divided each of these into Democratic and Republican sub-groups.
| Category | Republican | Democrat |
| True Believers | R1, R2, R3 | D1, D2 |
| Moderate Republican | R4, R5 | |
| Balanced | RD, DRD | D3, D3R, D4, RD4 |
We locate these groups on four maps, one for True Believer counties of extreme polarization, two not extreme but Republican leaning counties, two (with 4 sub-groups) that are majority Democratic, and one (with two subgroups) that is majority Republican.
Population, votes for Obama and Romney, and values for political character are summarized in Table 1. The table numbers should surprise many readers. True believer America is hugely important to the parties, especially the Democrats, (and symbolically for Republicans?), but contain just 103 million people and 41 million voters, about one-third of the total.
| Clusters of US Counties on Presidential Politics, 2008-2012 | |||||||||
| Group | # of Counties | % Obama 2012 | Settlement Pattern | Culture | Race | Obama vote | Romney | D Margin | Population (Thousands) |
| D1 | 104 | 72 | Lg met | Prog + | 47 | 19,600 | 7,077 | 12,523 | 68,307 |
| D2 | 112 | 70 | non-met | moderate | 56 | 820 | 353 | 467 | 2,776 |
| D extreme | 216 | 70 | mixed | high min | 20,420 | 7,430 | 12,990 | 71,083 | |
| R3 | 506 | 32 | rural | Cons+ | 13 | 1,342 | 2,791 | (1,449) | 10,034 |
| R2 | 454 | 25 | non-met | Cons | 21 | 1,737 | 5,297 | (3,560) | 17,920 |
| R1 | 340 | 18 | rural | Cons + | 25 | 323 | 1,587 | (1,264) | 4,164 |
| R extreme | 1300 | 26 | rural, non-met | Cons | low | 3,402 | 9,675 | (6,273) | 32,118 |
| All True Bel | 1516 | 58 | all | 23,827 | 17,105 | 6,722 | 103,201 | ||
| R5 | 528 | 40 | Non-met | moderate | 19 | 3,944 | 5,777 | (1,833) | 23,231 |
| R4 | 278 | 36 | Larg met | moderate | 21 | 6,774 | 11,581 | (4,867) | 44,727 |
| R not extreme | 806 | 37 | mix | moderate | 20 | 10,718 | 17,358 | (6,640) | 67,958 |
| D3 | 194 | 56.5 | non-metro | mod to pro | 21 | 2,227 | 1,727 | 500 | 8,723 |
| RD3 | 38 | 49 | non-metro | mod to pro | 28 | 415 | 435 | (20) | 2,033 |
| D3 total | 232 | 55 | non-metro | 22 | 2,642 | 2,162 | 480 | 10,756 | |
| D4 | 194 | 56 | large met | Prog+ | 30 | 22,573 | 17,792 | 4,780 | 95,835 |
| RD4 | 68 | 47.3 | Prog+ | 24 | 4,677 | 5,358 | (681) | 24,865 | |
| RD total | 262 | 54 | Prog+ | 29 | 27,250 | 23,150 | 4,100 | 120,700 | |
| R>D | 244 | 45.2 | rural | Mod to cons | 19 | 946 | 1,486 | (540) | 4,574 |
| DR>D | 92 | 53.6 | rural | Mod to cons | 21 | 454 | 396 | 58 | 1,814 |
| R>D total | 344 | rural | Mod to cons | 19 | 1,400 | 1,882 | (482) | 6,388 | |
| All balanced | 830 | 54 | 31,262 | 26,194 | 5,068 | 137,844 | |||
| All D | 62.5 | metro dominated | 45,674 | 27,335 | 18,379 | 177,455 | |||
| All R | 37 | nonmet dominated | 20,155 | 34,312 | (14,157) | 131,548 | |||
| All groups | 51.6 | 65,832 | 61,647 | 4,185 | 309,003 | ||||
Another 68 million people and 28 million voters are in strong Republican areas, which, together with the true believer Republican areas, give the GOP dominance in counties with 100 million people and 41 million voters—about one-third of the total. This is higher than the strongly Democratic core areas with 71 million people and 28 million voters.
But the really interesting story is about the remainder of the country, which we argue is somewhat balanced, with 137 million people (44%) and 57 million voters (45%). These are significant and meaningful battleground territories, and a warning to both parties to be more careful in proclaiming long term dominance. But it is true that the total population in Democratic majority groups totals 177 million, compared to 132 million for the Republican clusters, and thus the basis for a Democratic net margin in 2012.
We will discuss the variable settlement and cultural characteristics of the clusters through an analysis of the four maps.
True Believers
OK here is the quintessential polarization! Between areas of concentrated blue. Group D1 is mainly in large metropolitan cores, especially on the two coasts – the northeastern Megalopolis, and Los Angeles, San Francisco, Portland and Seattle, but also Chicago, Detroit, Minneapolis, plus a few ethnic minority areas, as along the border with Mexico, and noted in the table as metropolitan, high in minorities, and culturally progressive. Cluster D2 is smaller, non-metropolitan, majority minority, culturally moderate, and primarily with black, Hispanic or Native American settlement, but with a different sub-set of counties in Vermont, upstate New York, and in environmental recreation areas in the west. These tilt more progressive.
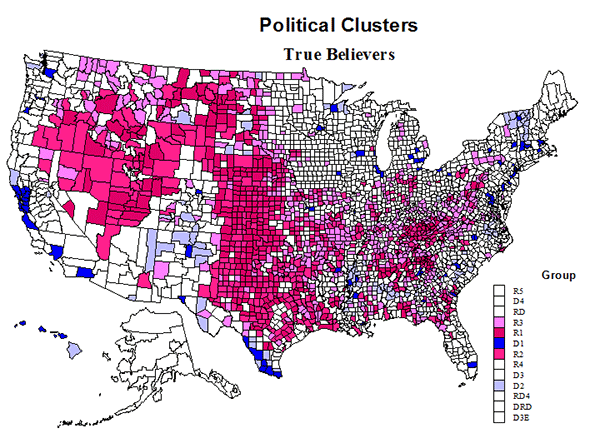
The contrast with the true believer Republican clusters is profound. R1 and R2 are the most conservative, mainly rural and non-metropolitan respectively, and tend to occupy the same areas, dominating huge portions of two realms: the western high plains from Texas to North Dakota, and the extended Mormon region, centered on Utah but stretching to neighboring states. In addition, there are some added counties in Appalachia and into the south. R3 counties are as conservative and also rural, and are found mainly in Appalachia, Missouri (Ozarks) and in a far north belt from the Dakotas to eastern Washington. These true believer red counties constitute over half of US counties, and almost half the territory, but have only 11 percent of the population.
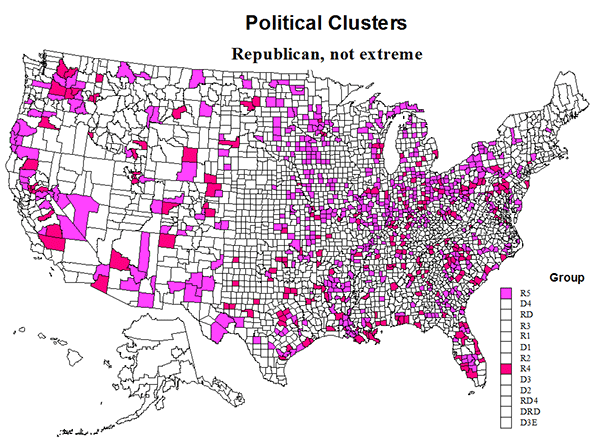
The strongly Republican , yet less extreme counties have a very different geography. They do tend to occur together, embracing many smaller metropolitan areas, together with adjoining non-metro counties. They tend to be culturally moderate, and much more populous than the extreme R1 to R3 groups, with 68 million people, and as important to Republican margins. They are most prevalent across the west and “the north of Appalachian north --- OH, IL, MI, IN, WI, MO, and MN --- than in metropolitan and suburban areas in the south, notably FL, NC, SC, LA, and TX, and then in the less or smaller metropolitan west.
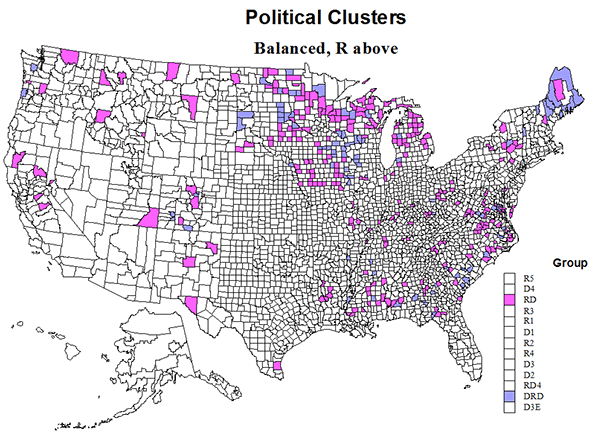
The more balanced counties have 138 million people, and provided a small but critical margin for Obama in 2012, with 106 million in the D majority groups, and 32 million in the R majority groups.
The Republican majority balance group RD is rural and moderately conservative. They are most prevalent across the northern edge of the country from Maine to MI, WI, MN, and IA to the Dakotas, a historically moderate area, with scattered exurban and rural areas in the west (mainly R carried) and scattered across the south from LA to VA (also mainly R carried)
The Democratic majority balanced groups D4 and D3 are quite varied, almost a prototype of the US average! The D3 counties are mainly non-metropolitan, and moderate to progressive. The D and R carried counties tend to be intermingled. These counties are most prevalent in the “old” north from MN and IA to northern New England, but also fairly common in the Rockies and along the Pacific coast. Many of these counties were and even still are resource-oriented, and many have become exurban professional and/or environmental amenity dependent (CO, CA, WA, ID, NM, ME, NH).
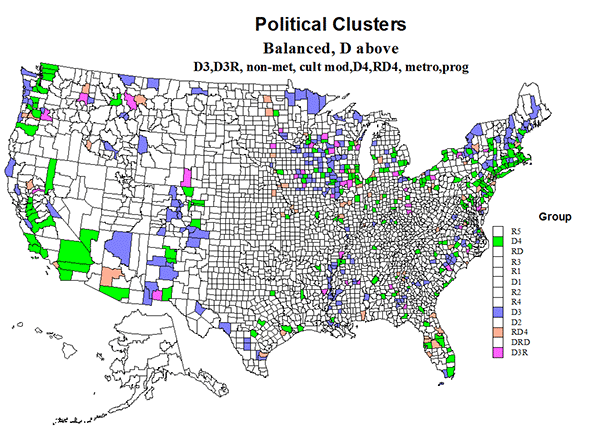
The D4 group is larger and less dominantly Democrat carried. It is mainly larger metropolitan and culturally progressive, but not as strongly Democratic as the D1 counties. The difference is that many are smaller, often “satellite” metropolitan areas, or suburban-exurban counties, as along the Pacific coast, in Florida and Megalapolis. Many were counties that were historically Republican but have become increasingly socially liberal, experiencing declines in the Republican margins. Notable are big areas like San Diego, Riverside-San Bernardino, Phoenix, Dallas, Houston, suburban Denver, and suburban-exurban NJ, NY, and CT.
The balanced counties would seem difficult for a very conservative “Tea party” candidate, and good for Hilary Clinton, but could possibly revert to Republican with a more mainstream candidate. Thus it is premature to write off the long term Republican prospects. Both parties have a long history of decline and resurgence. If mainstream Republican leaders can restrain the extreme conservatives, then there is at least some prospect of a serious realignment, with perhaps four parties for a transition period, the Tea Party, a Business party, a Green party (progressive environmentalists), historically liberal Republican, and dare I hope, a (social) Democratic party? Bring back economics and this could happen.
Richard Morrill is Professor Emeritus of Geography and Environmental Studies, University of Washington. His research interests include: political geography (voting behavior, redistricting, local governance), population/demography/settlement/migration, urban geography and planning, urban transportation (i.e., old fashioned generalist).


migration trends
This suggests that liberals can't survive on their own. They have to be looting or mooching and then when they have bankrupted one area, they follow to the next, free market, soon to be destroyed area.