
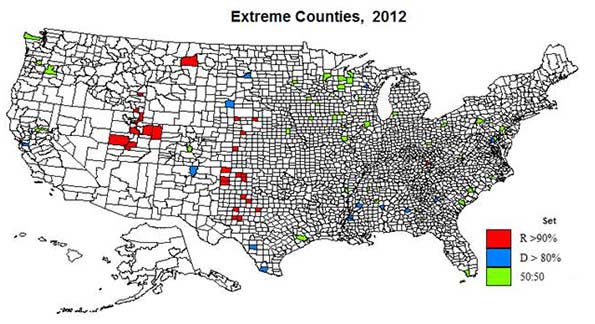
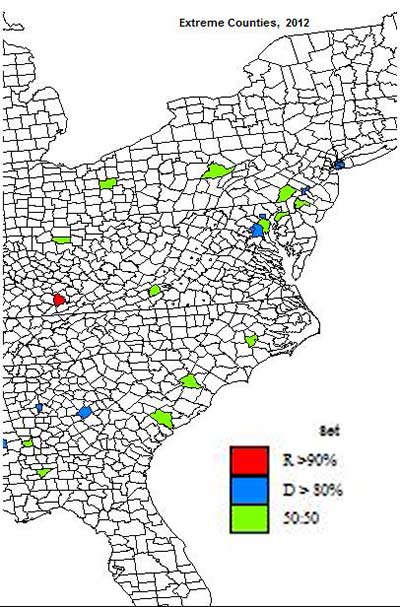
Recently I grouped all US counties into several categories, from True Believers R and D, R and D leaning groups, and also those areas that are more equally divided. In anticipating the 2016 election, I take here a brief look at a small number of counties (2012 data) that are extreme cases of R voting (over 90%, 28 counties), of D voting (over 80%, 26 counties), and of 50:50 voting (39 counties from 49.7 to 50.3 D vote). These are also shown on the maps. Note that the D counties in blue don’t look impressive, as they are small in area, but big in votes. How do these three sets differ in geography and in character?
Set 1: Ultra Republican
The extreme R counties are an amazing set. Ten of the 28 (8 in Utah, 2 in Idaho) are dominantly Mormon. The non-Mormon counties include 17 scattered across the high plains from Montana, 1, Nebraska, 3, Kansas, 1, Oklahoma 1, and 11 in Texas, with one outlier in eastern Kentucky. Only one is east of the 100th Meridian, famous for dividing east and west in the US. All these counties are basically conservative on social issues.
Overall densities are far lower and rural shares far higher than for the other sets. They are overwhelmingly white (92%) and less than 1% black on average. They have the highest shares of husband-wife families, with and without children, and the lowest shares of single parent families, roommates and singles. For example the black population is essentially 0 in half the counties. Husband-wife and children households ae exceptionally high in 5 counties: Franklin, ID; and Duchesne, Morgan, Sevier, and Uintah Utah—all Mormon. The roommate share is under 2 percent in 7 counties, compared to a national average of almost 5.
Male labor force participation averages a high 73% and unemployment a low 3.8%. As expected for these locations, farming is a frequent occupation in these counties, exceeding 10% in 8 counties, as in MT, NE, and TX. Finally church attendance is far higher than in the other sets, averaging 71% compared to 48% in the set 2 counties.
The Mormon counties exhibit some variation in size and settlement. Five are all rural, four are rural and small town (micropolitan), but one is a small metropolis, Utah county (Provo, with Brigham Young University), perhaps the heart of Mormon orthodoxy. The 18 non-Mormon counties include 13 small rural counties and 5 counties (all in Texas) with small cities.
Since the total vote in these counties was only 234,000 (76,000 without Utah county!) and 92% R, it is probably not worth a Democrat candidate spending much effort in these locales. Yet it is possible that without the “negativity” of race, an Anglo woman at the top of Democratic ticket should do better in conservative white settings.
Set 2: Ultra Democratic
The extreme D counties are similarly an amazing set, just in different dimensions. The dominant characteristic is the very high minority share – in all 26 counties – and correlated with that high shares of single parent families, unemployment, and general and especially child poverty. The minority share averages 81%, with 43% black. Thirteen have high black shares: mostly southern and rural, in AL, GA, MS, but also Washington, DC, Baltimore, and Prince George, MD. Four have high Hispanic shares: TX, NM, three Native American (ND, SD, WI), and six are more racially mixed: San Francisco and Alameda, CA, Philadelphia, and 4 New York city boroughs.
The second distinguishing feature is dense urban character and sheer size, but only for a subset of 12 counties, as 9 are rural or small town minority counties. The large urban counties include San Francisco, Alameda, Washington DC, Orleans, Prince George, Baltimore, St. Louis, Bronx, Kings, New York, Queens, and Philadelphia. These set 2 metropolitan counties are mainly coastal (plus St. Louis and Orleans), while rural minority counties are mainly in the northern plains, (Native American) or the southern “Black belt”.
The small city minority counties are Macon, AL (Tuskegee), Hancock, GA, Taos, NM, Starr and Zavala, TX, Claiborne, Holmes and Jefferson, MS, and Shannon, SD, leaving only 3 totally rural counties, Greene, AL, Sioux, ND and Menominee, WI.
These highest D counties also have the highest share of people 18-44, of singles and of roommate households, and the lowest in families, as well as being lowest in labor force participation and church attendance but highest in poverty and unemployment.
Even though highly Democratic, with a 2012 D vote of 4,000,000 to 700,000 R, the total vote is so large that it may be worth a fair Republican campaign effort simply to reduce the giant D margin, which was key to the 2008 and 2012 D wins. Without the dominance of race, Republicans might do better, if voter turnout of minorities falls.
Set 3: Balanced 50-50 counties
The set 3 counties with a 50:50 D and R split, are far more diverse and complex, as we might expect, and suggest how difficult they can be for candidates to create convincing messages! These counties are intermediate in density and are quite high in shares of micropolitan territory, that is, independent small city counties.
Of the 39 counties, 6 are entirely rural (GA, IA, MS and WI (3)), while one (Harris-Houston) is a giant metropolitan core county with almost half the total vote of these set 3 counties. Five are suburban to large metro areas – in GA, MD, NJ, PA, and WA. Five are small metropolitan areas, Lincoln, NE (Lancaster), Florence, SC, State College (Centre), PA, Montgomery, VA (Blacksburg), and Canton (Stark), OH. Thus 23 are small city micropolitan, with counties in AR, CA, CO, IL, IA, MD, MI, MN, MS, NC, OH, OR, SC, WA, and WI.
While the set 1 counties are all but one in the western half of the country, and the set 2 counties, coastal urban or southern rural-small town, the set 3 counties are most prevalent in the upper Midwest: IL 2, IA 5, MN 3, WI 5, MI 1, OH 1, and NE 1, almost half the counties, with another ten in the south, AR 1, MS 2, GA 2, SC 2, FL 1, NC 1, and VA, 1. The single largest cluster of these 50:50 counties is in northwestern Wisconsin, with an additional county across the state line in Minnesota.
In social and economic characteristics these counties tend to be intermediate between the set 1 and set 2 counties, for example averaging 22% minority (closer to set 1 than to set 2), but fairly high in a few counties in the south. They tend to be a little closer to the set 2 D set on the social dimension: shares of roommates, singles, and in religiosity, but closer to the set 1 R set in economic, income and job variables, as in higher labor force participation and lower poverty rates.
Clearly these set 3 counties represent the impressive diversity of the more balanced areas of American electorate, where campaigning will be especially critical.
| Table 1 | Differences between D, R and 50:50 Sets | |||
| Averages | ||||
| Variable | Set 1 R | Set 2 D | Set 3 50:50 | |
| Age 18-44 | 30 | 39 | 33 | |
| White | 92 | 33 | 82 | |
| Black | 0.7 | 43 | 11 | |
| Minority | 16 | 81 | 22 | |
| HW w children | 28 | 11 | 20 | |
| Single parent | 10 | 29 | 16 | |
| Singles | 22 | 30 | 28 | |
| Urbanized area | 3 | 54 | 21 | |
| UC (small city) | 18 | 11 | 26 | |
| Rural | 82 | 32 | 53 | |
| Male Labor Force Participation | 73 | 62 | 69 | |
| Unemploy | 3.8 | 12.2 | 7.3 | |
| Services | 15 | 22 | 17 | |
| Farm | 7 | 1 | 1.7 | |
| Churches/100 | 4 | 1.5 | 1.8 | |
| Poor | 13 | 26 | 14.5 | |
| Child Poor | 17 | 36 | 18 | |
Conclusion
These counties are but a small sample of the 3,180 counties. Yet they represent the extreme drivers of a well-publicized American polarization, but also where we see a non-polarized America. The regional concentrations of the three helps illuminate the amazing differences in American cultural and political geography.
Richard Morrill is Professor Emeritus of Geography and Environmental Studies, University of Washington. His research interests include: political geography (voting behavior, redistricting, local governance), population/demography/settlement/migration, urban geography and planning, urban transportation (i.e., old fashioned generalist).


Methodology Question
You used different percentages for strong R criteria (90%) than strong D (80%).
Why did you not use the same percentages?
Curious what the results would be if you used 80% for R.
All these counties are
All these counties are basically conservative on social issues...and Duchesne, Morgan, Sevier, and Uintah Utah—all Mormon...
This sign is on I-70 in Sevier County and is a knock on Las Vegas's slogan:
Beautiful country and wonderful people, at least from the few times I've overnighted in Richfield, the county seat. I've fantasized, though, about adding another panel to the billboard, a side shot of an old guy sitting on a toilet. Because EVERYTHING that happens in Sevier County you can share with your friends...