
American cities seemed to be re-centralizing in the years immediately following the Great Recession, but new American Community Survey data indicates that, contrary to conventional wisdom, Americans continue to disperse though at a much reduced rate. The Census Bureau has just released the five year American Community Survey (2010-2014) small area data used by the City Sector Model to report on population trends within functional sectors of metropolitan areas. The City Sector Model classifies small areas as the urban core, suburban or ex-urban without reference to the more traditional analysis method that relied on core cities and suburbs (Note 1). The principal purpose is to compare finer-grained data and trends in parts of the metropolitan area that are more reflective of pre-World War II urban forms and lifestyles (the Urban Core: CBD and the Urban Core Ring) and the balance of the metropolitan area, which is automobile oriented (the Earlier Suburbs, Later Suburbs and Exurbs).
These data were collected over a five year period, with the middle year being 2012. General trends can be examined in comparison to the 2008-2012 American Community Survey, with a middle year of 2010. At the same time, caution is warranted since the American Community Survey is not a count, such as is collected in the decennial censuses. For simplicity, this article refers to the 2010 to 2014 data as 2012 and the 2008 to 2012 data as 2010.
More Modest Dispersion
The continuing dispersion was most evident in the rising 0.4 percentage point share (from 26.9% to 27.3%) in the Later Suburbs – with mid-point construction dates of 1980 or later. Two of the other four functional city sectors experienced declines in their shares, with the higher density, transit-, walking- and cycling-oriented Urban Core Ring dropping from 13.5% to 13.4% and the Earlier Suburbs dropping from 41.9% to 41.6% of the major metropolitan population. The earlier suburbs are automobile oriented and have houses with median construction dates of 1946 through 1979. The Urban Core CBD sector and the exurbs have retained their previous share of the population since 2010 (Figure: Growth Share by City Sector: 2010-2012 and Population Share by City Sector).
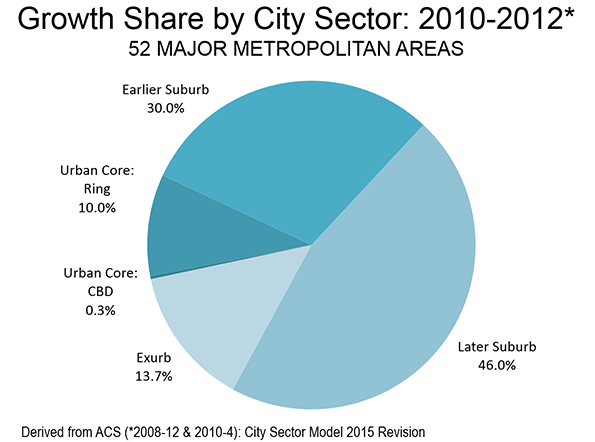
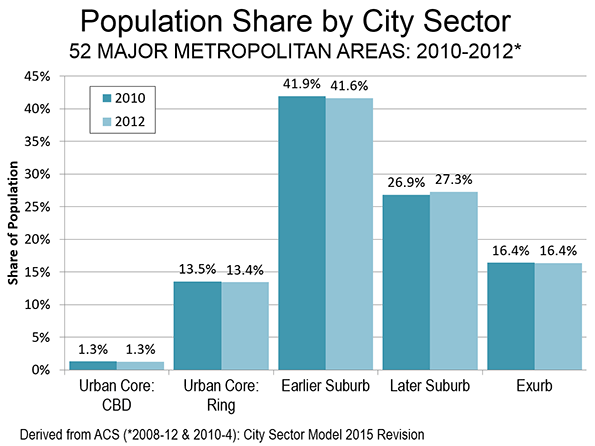
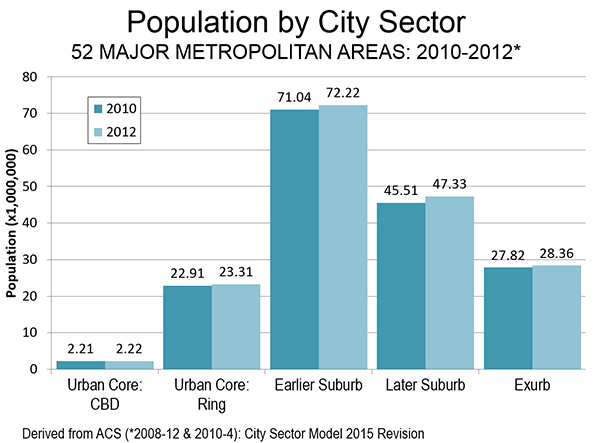
Overall the Urban Core, which consists of the CBD and Ring dropped from 14.8% of the population to 14.7%. If this rate were to continue through the 2020 census, the Urban Core share of the major metropolitan area population would drop by 0.5 percentage points, considerably less than the 1.7 percentage point loss between 2000 and 2010. Nonetheless, the suburbs and exurbs accounted for nearly 90% of the growth between 2010 and 2012 (Figure: Population by City Sector). Suburbia, even exurbia, is where the growth is
The new data also suggests that much of that growth was in the suburban areas of the historical core municipalities (newer and automobile oriented). For example, large areas of core cities are functionally suburban, such as in Phoenix, Dallas, Los Angeles, Portland, Atlanta, Charlotte, and elsewhere.
The bottom line , as we have indicated in previous articles, is this: the data shows virtually no “return to the city.” Between 2010 and 2012 the suburbs and exurbs gained 3.5 million residents, while the Urban Cores gained 400,000. The Exurbs alone gained more population than the Urban Core (CBD and Ring combined). This has also been evident in each year of this decade by the continuing domestic migration to suburban and exurban counties, which has exceeded that of counties that contain the urban cores.
New York, Other Legacy Cities and the Balance
There is considerable variation in the size and growth of Urban Cores among the major metropolitan areas. The Urban Cores in the “legacy cities” are far larger and are capturing a far higher share of their metropolitan area growth. The legacy cities are the six metropolitan areas that have downtowns (central business districts or CBD’s) with more than 200,000 jobs (New York, Chicago, Philadelphia, San Francisco, Boston and Washington), These are generally older cities and the strength of their Urban Cores is illustrated by the fact that, combined, the core cities of these metropolitan areas account for 55% of the destinations of transit committing trips in the nation.
Even among the legacy cities, strong distinctions exist. New York, with central business district employment of nearly 2 million, has nearly 4 times the jobs that of its Chicago counterpart. Indeed, New York’s central business district employment exceeds that of the combined employment in the downtowns other five legacy cities. Thus, as in other indicators of intense urbanism (such as transit ridership and the share of the national transit ridership increase), New York is in a “league” of its own.
As of 2012, New York’s Urban Core included approximately 53% of the metropolitan area population. This is more than double the 26% share of the metropolitan population in the urban cores of Chicago, Philadelphia, San Francisco, Boston and Washington (Figure Legacy Cities and Others: Population).
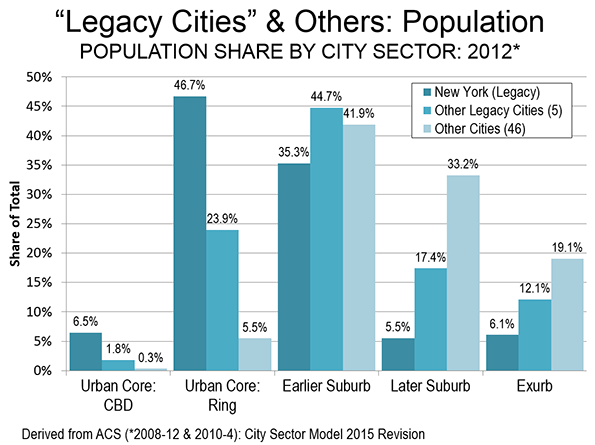
The difference between the legacy cities and the other 46 metropolitan areas is even more stark. On average, other metropolitan areas have on average only approximately seven percent of their populations in their urban cores, compared to 53 percent in New York and 26 percent in the other five.
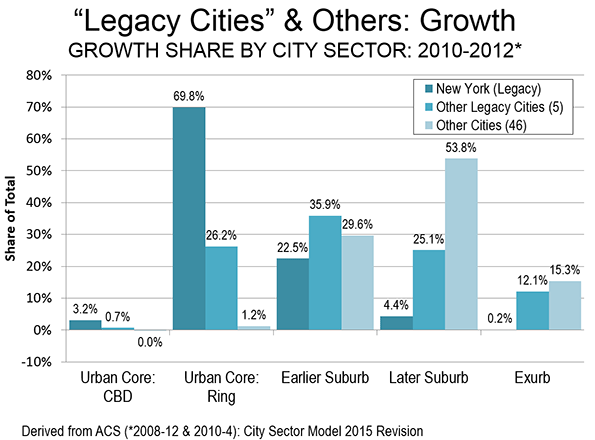
There are even greater disparities in population growth. Between 2010 and 2012, 73% of the population growth in the New York metropolitan area was in the Urban Core. This is 2.7 times the average 27% of metropolitan growth in the urban cores of the other five legacy cities. Thus, by two measures, population concentration and population growth in the urban cores, Chicago, Boston and the other legacy cities cannot even present themselves as “little New York's”.
Most other cities are not even in the same league as Chicago or Boston. None achieved a 20 percent Urban Core growth percentage, though St. Louis was close (19.8 percent), and Seattle was next (15.0 percent). The urban core growth in the other 46 cities was less than 6% (Figure Legacy Cities and Others: Growth). Even in Portland, with its strong densification policies biased toward urban core development and discouraging towards suburban development, no more than average 10% of its growth took place in its Urban Core. Nearly 90 percent of Portland’s growth was in the suburbs and exurbs.
Back to Normalcy?
The 2010-2012 data does not indicate a return to the near monopoly on growth enjoyed by the suburbs and exurbs in the 1990s and 2000s. But more recent data suggests stronger suburban performance, as chronicled by William Frey at the Brookings Institution and Jed Kolko at Trulia. At the same time, it is good to see the upward trends in the in the urban cores, which as metropolitan areas as diverse as St. Louis and Seattle show, do not depend on suburban misfortune to prosper. The cores are an important part of a healthy metropolitan system, although in most places they are far smaller in population, and growth, than the suburban rings.
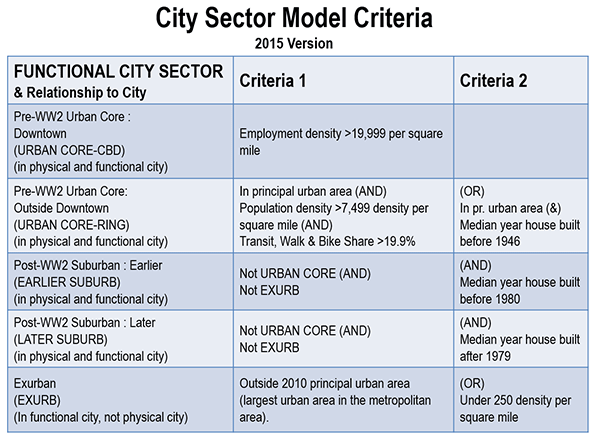
Note: The “City Sector Model” provides data for areas (Zip Code Analysis Zones) within metropolitan areas, as opposed to data based on jurisdictional boundaries, such as city limits. The data is based on small areas, Zip Code Tabulation Areas (ZCTA’s). The criteria for classification is indicated in the Figure: City Sector Model Criteria.
Wendell Cox is Chair, Housing Affordability and Municipal Policy for the Frontier Centre for Public Policy (Canada), is a Senior Fellow of the Center for Opportunity Urbanism (US), a member of the Board of Advisors of the Center for Demographics and Policy at Chapman University (California) and principal of Demographia, an international public policy and demographics firm.He is co-author of the "Demographia International Housing Affordability Survey" and author of "Demographia World Urban Areas" and "War on the Dream: How Anti-Sprawl Policy Threatens the Quality of Life." He was appointed to three terms on the Los Angeles County Transportation Commission, where he served with the leading city and county leadership as the only non-elected member. He served as a visiting professor at the Conservatoire National des Arts et Metiers, a national university in Paris.
Photo: New York's Growing Skyline by Citizen59 (Own work) [CC BY 3.0], via Wikimedia Commons


