
We regularly hear the argument that living in a compact city is more affordable than living in one that is more spread out. But what does the data actually show about the cost of housing in compact cities, and the cost of transport in these dense places? The relationship between those two expenses and the compactness of a city could tell us much about which kinds of places are most affordable, since those two costs together dominate household budgets.
Advocates of denser urban environments have developed an index to measure the effects of a range of aspects of city living, such as vehicle miles traveled, traffic safety, congestion, the cost of housing, the cost of transportation, and health outcomes, among many other issues. The index takes into account several metrics, such as density, street accessibility and the mix of land uses.
The index was conceived with the intent to study presumed negatives of city growth, and to make such growth “smarter.” Since the impulse to create it was advocacy-driven, it may lack objectivity. Notwithstanding this potential bias, and lacking alternative data, we used it as the default measure for our analyses, and consider our work a chance to test the validity and reliability of the index.
First, we looked at housing costs. Casual and investigative observers seem to agree that housing costs do rise with city compactness. A recent report on the effects of compactness determined that housing costs increased by 1.1% for every 10-point increase in the compactness index. Other researchers have come to similar conclusions, using only population density as an indicator.
Chart 1, which plots data from the 2015 Consumer Expenditure Survey, confirms this general agreement on the correlation between compactness and housing costs. But questions arise from the sharp differences between pairs of cities.
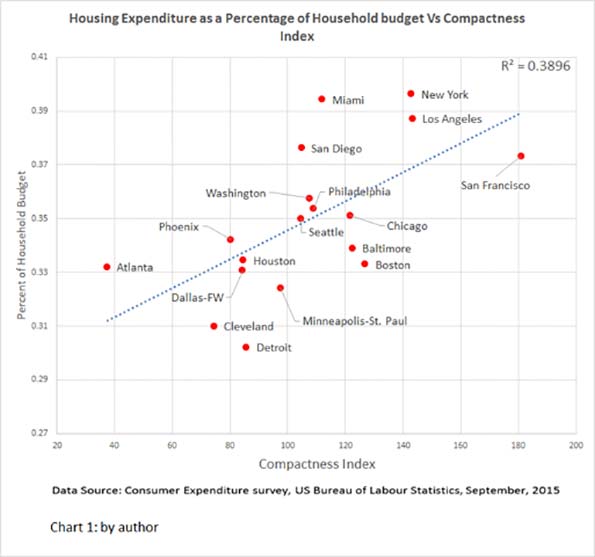
For example, Boston and Atlanta residents use the same percentage of their budgets — 33% — for housing. Yet Boston’s compactness index is at least 90 points higher: 37.4 for Atlanta, vs 126.9 for Boston. According to Smart Growth theory, that difference should bring housing expenditures for Bostonians to 43%, about the same level that is experienced by New Yorkers.
In another comparison, Boston and Miami differ little in compactness: 126.9 vs 112. Yet these two cities differ substantially in the percentage of household budget residents devote to housing costs - 33% vs 39%.
Clearly, in both these examples and in the chart above, compactness is but one of many factors and, perhaps, not the dominant one in the relationship between a city's housing costs and its compactness. Others need to be identified, quantified and incorporated. The trend, however, is indisputable: Greater compactness increases housing costs.
Do transportation costs follow the same trend?
According to theory, cities that are more compact offer more transport options, particularly public transit systems, some of which, like subways, outperform all other modes for time — especially work commute time — and provide travel options that are more affordable. Walking and biking may also be alternate means of mobility that help hold down household transport expenditures in compact cities. The association between density and high non-auto share of trips has already been demonstrated.
Consumer Expenditure Survey data from 2015, when plotted, confirms this assumption. Chart 2 shows a decreasing proportion of the household budget being used for transportation as a city’s compactness index increases.
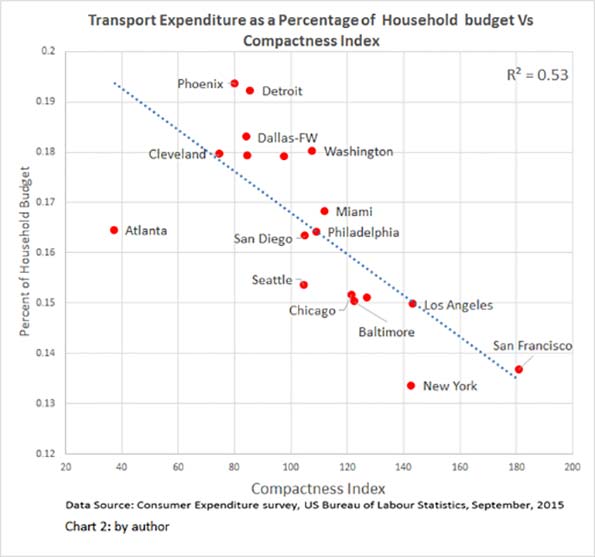
However, as with housing costs, a close look at the differences between paired cities raises questions. Atlanta and Philadelphia share the same percentage of household budget expenditure on transport, 16%. Yet they differ by 70 points on the compactness index, 37.4 vs 109.05. Meanwhile, Washington and Seattle register an almost identical compactness index — 107.6 vs 104.6 — but the latter, contradicting theory, has transportation costs that are 3 percentage points lower, even though it lacks a subway. Both these cases demonstrate that the current model for measuring the impact of compactness needs fundamental refinements to improve its predictive value.
So far, the data show two countervailing trends: Housing costs rise with compactness, while transportation costs fall. This finding leaves the question of whether more compact cities are more affordable to live in, at least with respect to these two expenditures that consume about half of a household’s budget.
Using the same data from the CES for the 18 cities, we plotted the results of combining the two expenditures, as a percentage of the household budget.
Chart 3 shows an inverse, albeit weak, association of compactness with combined household expenditures of housing and transportation. It clearly does not indicate that more compact cities are more affordable for the average household. Upon a closer look the chart reveals some instructive surprises.
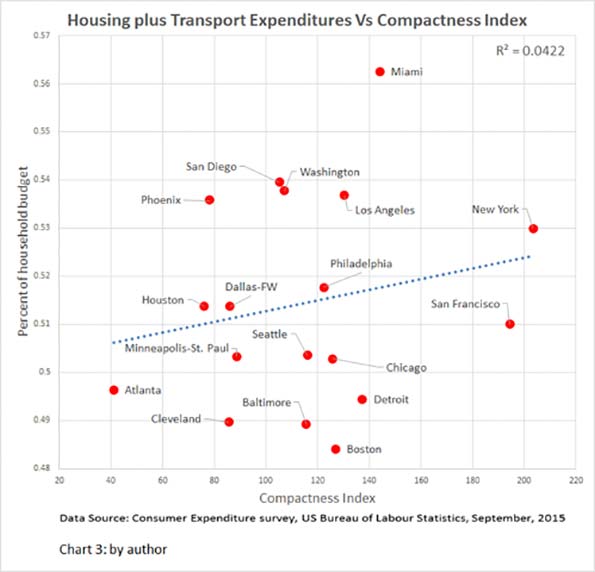
First, Atlanta appears among a group of five most affordable cities, even though it has by far the lowest compactness index (40.9) of all eighteen cities in the CES survey. According to traded wisdom, its transport costs, being almost entirely based on automobile travel, should overwhelm its housing expenditures.
Contradicting theory, Atlanta posts next to lowest average housing cost ($16,316/year), and also one but lowest transportation costs ($8,086/year). When considering that average income in Atlanta is on a par with that in Los Angeles ($69,821 vs $69,118), and that its compactness index is 80 points lower than LA’s, its comparative affordability challenges current thinking about compactness and its effects.
Second, four cities hover around the same point of the index (#110), yet they cover almost the entire gamut of budget percentage expenditure (49% to 54%) for combined housing-plus-transport costs. The same is true for five cities aligning around the #130 of the index.
It's apparent that current theory falls short of adequately explaining field data. A city planner would find little comfort in knowing that a fourfold range of compactness can be equated with the same level of affordability, or that the same level of compactness can be associated with a wide range of combined transportation and housing expenditures. If anything, these results suggest that, because average housing expenses are double those of transportation, a yet-to-be-determined density ceiling might be an effective means of increasing a city’s affordability.
The CES data is only a snapshot in time that may reflect transient conditions, such as gasoline prices, local inflated real estate markets, congestion levels that affect gas consumption, effectiveness and reach of public transit and so on. Variability in these factors will always affect the average transport and housing expenditures. A predictive model should be robust enough to handle such fluctuations, if it is to have practical value.
Yes, greater compactness is associated with higher housing costs and lower transportation costs. But, contrary to unsubstantiated assertions, when these are combined, the result is less — not more — overall affordability.
Fanis Grammenos heads Urban Pattern Associates (UPA), a planning consultancy. UPA researches and promotes sustainable planning practices including the implementation of the Fused Grid, a new urban network model. He is a regular columnist for the Canadian Home Builder magazine, and author of Remaking the City Street Grid: A model for urban and suburban development. Reach him at fanis.grammenos at gmail.com.
Flickr photo by Tim Bartel of a San Francisco neighborhood


