
Two audacious quotes in planning literature underpin this article and substitute for an introduction:
"As in the pseudoscience of bloodletting, just so in the pseudoscience of city rebuilding and planning, years of learning and a plethora of subtle and complicated dogma have arisen on a foundation of nonsense."
And:
"Orthodox planning is much imbued with puritanical and Utopian conceptions of how people should spend their free time, and in planning, these moralisms on people's private lives are deeply confused with concepts about the workings of cities"
These forceful warnings, by Jane Jacobs , respectively, are not entirely new (careers and lives have been ruined to unorthodox views), but bear repeating: Orthodoxy, dogmas, moralisms, utopianism, and pseudoscience are the shackles of scientific pursuits. They must be identified, exposed, and expunged.
In this piece, we take Jacobs' advise seriously, "I have learned yet again [….] what folly it is to take any thing for granted without examining it sceptically," by examining the case of certain assertions that drifted unnoticed into the realm of orthodoxy.
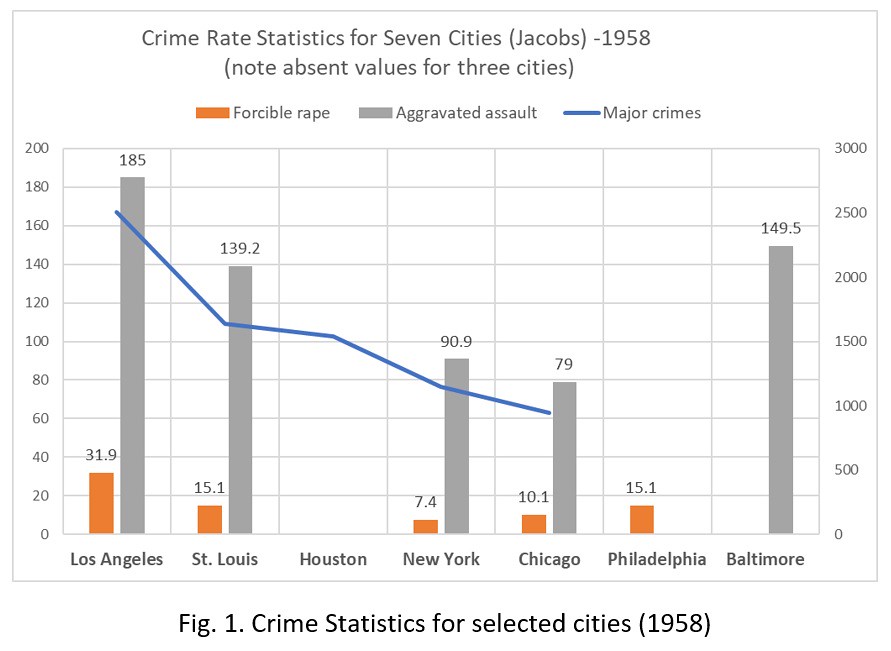
Fig. 1. Crime Statistics for selected cities (1958)
The Los Angeles logic
After listing crime figures in 1958 for seven cities and crime types (Fig 1) that show Los Angeles leading the set by large margins, and describing the city as "[….] almost all suburban. It has virtually no districts compact enough to qualify as dense city areas," Jane Jacobs concludes:
"The reasons for Los Angeles' high crime rates are undoubtedly complex, and at least in part obscure. But of this we can be sure: thinning out a city does not insure safety from crime and fear of crime. This is one of the conclusions that can be drawn within individual cities too, where pseudosuburbs or superannuated suburbs are ideally suited to rape, muggings, beatings, hold ups and the like."
The crime statistics of 1958 Los Angeles do stand out. But the city's comparative thinness (i.e., population density) is simply implied, not tabulated. Can this single, incomplete snapshot be enough ground for linking crime rate to thinness? Moreover, while this one cross-city statistic seemingly supports this thesis, can it be automatically extended to within-city comparisons without relevant district statistics? Apparently not. Newer, comprehensive and detailed tabulations reveal a complex picture that thwarts any attempts at an explanation of the differences in rates between cities or within cities. Extracting a purported definitive correlation is at best farfetched.
Cities, Crimes in Time
Take a 27-year long murder rate tabulation, for example. Murder prevalence rates for the same seven cities traced over time (1990 to 2016) would undeniably suggest "complicated and partly obscure reasons" for the observed changes:
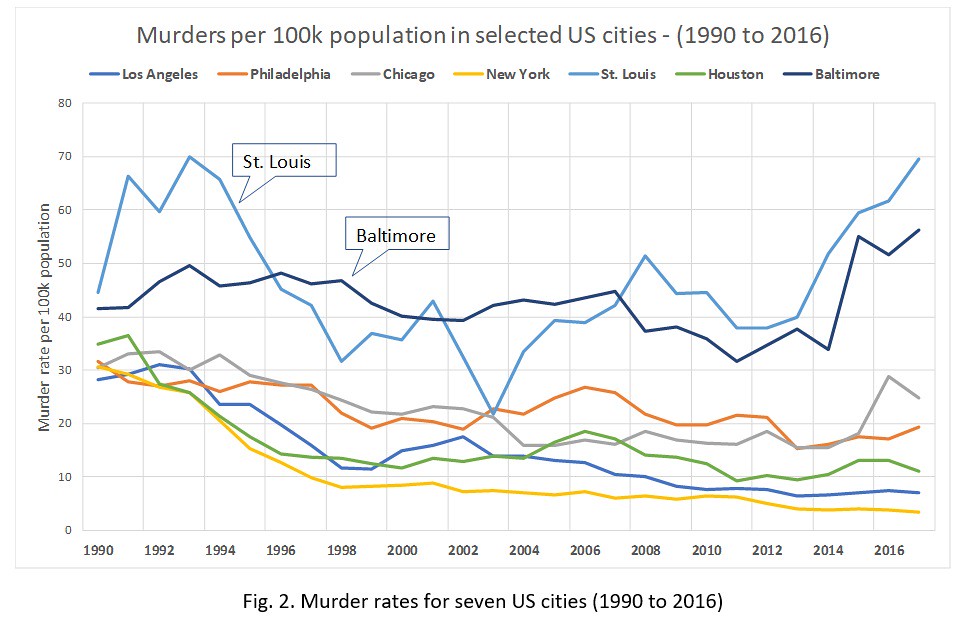
Fig. 2. Murder rates for seven US cities (1990 to 2016)
In 1990, unlike in 1958, the murder rate of L.A. was slightly lower than N.Y.'s, and the rates of both declined for the next 26 years, ultimately plateauing as did rates in all the cities in the set except two. St Louis' wildly fluctuating rate, which reached two dramatic peaks in 1993 and 2016, and Baltimore's erratic movement defy explanation by any single factor. The same can be said about the more or less steady decline of rates in the other five. Undoubtedly, there are many, and interacting, factors that produce such outcomes—some identifiable (e.g., policing), others obscure or, if discernible, hard to compute. Of those that could be measured, deciphering their relative impact would be a monumental research task. A snapshot at any particular year of these time series would invariably yield scant and worthless information, just as those of 1958. This obvious unfathomable complexity should restrain attempts at drawing simple conclusions, let alone causal relations.
Seven cities in 2009
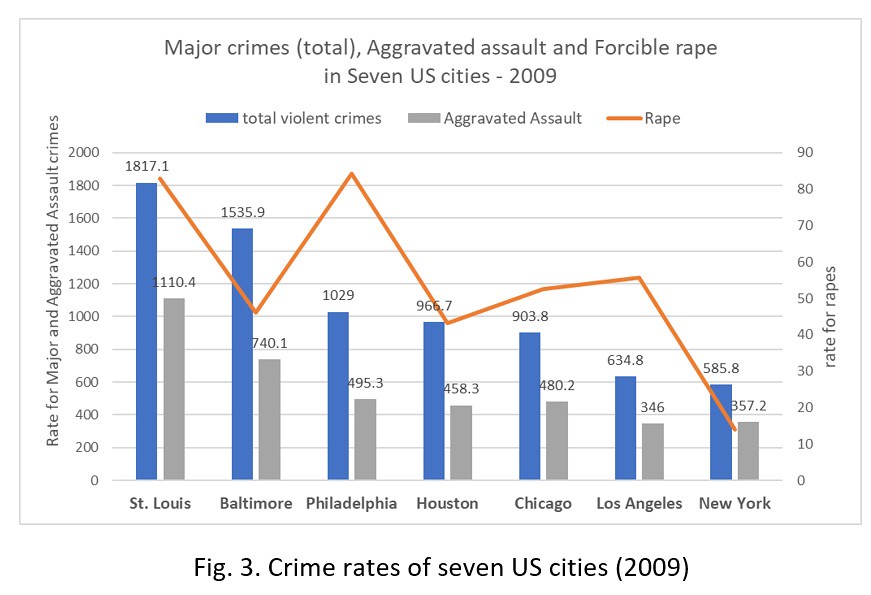
Fig. 3. Crime rates of seven US cities (2009)
For example, a 2009 snapshot of the same seven cities and crime types shows a new descending order of crime rates placing New York beside Los Angeles instead of at opposite ends (as in 1958). Just as with Figure 2, so it is with this one; no credible, simple explanation can be drawn about the influence of thinning or thickening of cities from this statistical snapshot. Many factors would be at work for such shifts to occur.
Metros, Cities and Suburbs
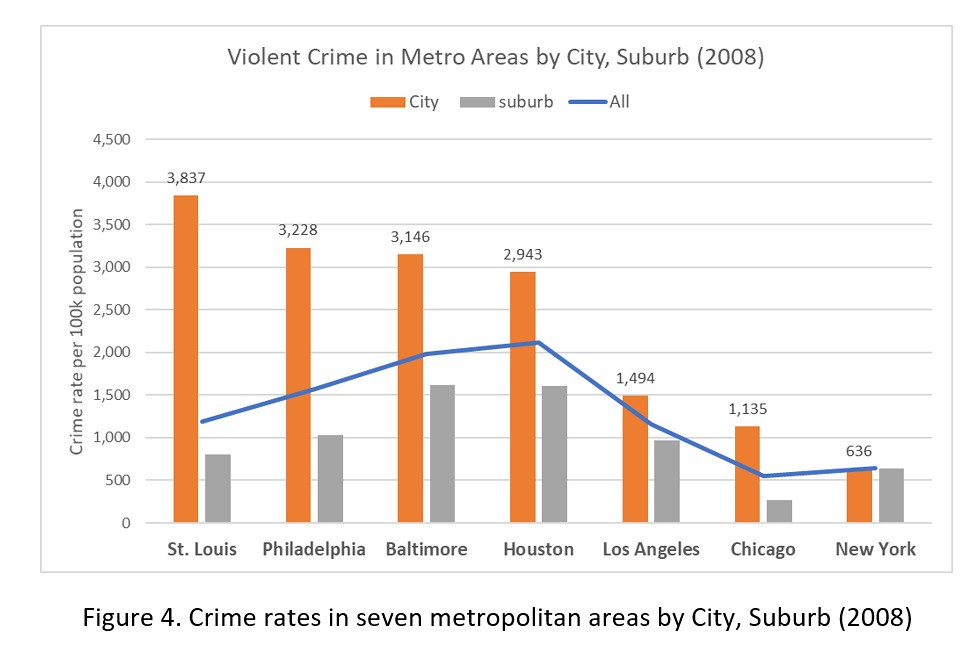
Figure 4. Crime rates in seven metropolitan areas by City, Suburb (2008)
Drawing another picture from metropolitan crime data challenges the rushed supposition that "pseudo suburbs or superannuated suburbs are ideally suited to rape, muggings, beatings, hold ups and the like." It shows that suburbs (i.e., thinner districts) have substantially lower crime rates, ranging from one half to one fifth of their central city counterparts. This lower rate suppresses the total city rate and, at the same time, complicates the search for a simple correlation between crime and any single attribute of a metropolitan city (e.g., density, income, GDP, education etc).
Other Research
At minimum, Figure 4 portrays the suburbs as having a clear advantage in public safety. This fact is corroborated by new research. One recent study stands out for its comprehensive, detailed method, and analytical rigor. Following a multivariate analysis of several factors it concludes: "The compactness index was positively related to violent crime…." And elsewhere: "These results also are consistent with findings from previous studies showing that life expectancy is reduced by violent crime. However, this study found that this indirect effect operates in the opposite direction of the earlier two [VMT and BMI] variables. Violent crime rates were lower in sprawling counties…."
A simpler bivariate analysis of districts within a city that we published on this site earlier also shows a positive association between compactness and crime.
A View from Hudson Street
As a rule, ideas and opinions are shaped, at least to some extent, by one's physical and cultural living environment. The resident of Hudson Street, is no exception: This street becomes a recurring motif and, imperceptibly, the foundation of a perspective on city and district planning: "The stretch of Hudson Street, where I live, is each day the scene of an intricate sidewalk ballet." And: "We [its residents] are the lucky possessors of a city order that makes it relatively simple to keep the peace because there are plenty of eyes on the street." And in the same vein: "The streets of the North End of Boston are outstanding examples [of this order]. They are probably as safe as any place on earth in this respect." Probably, but also hopefully, because of the lack of any empirical evidence.
How can such reassuring, general statements be questioned without guilt? On the other hand, without evidence, what comfort does this reassurance provide? Hudson—a main street—is still functioning and features a texture of uses analogous to the 1950s, though the mix may now be different. There are also likely more people treading on its sidewalks or driving on it today. What would current crime statistics show for the district that surrounds Hudson Street? Is it safer than other N.Y. districts?
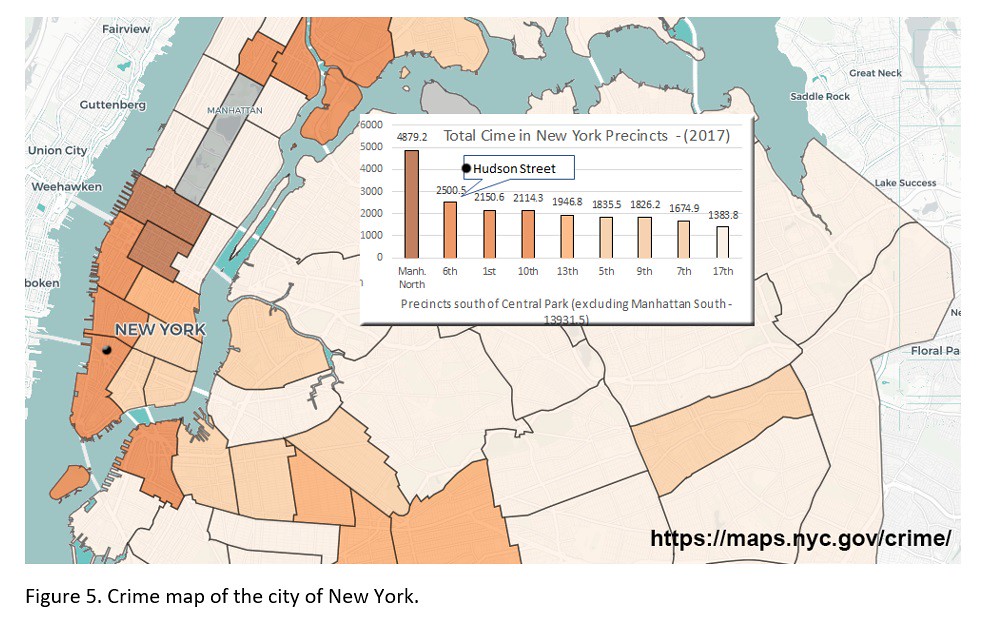
Figure 5. Crime map of the city of New York.
Of the ten districts (precincts) south of Central Park, two—North and South Manhattan—have inordinately high number of crimes followed by the 6th district, which includes Hudson Street. The remaining seven register lower rates with the 17th district (Tudor City) occupying the bottom rung; about half the 6th district's rate. Here, another complex picture emerges that disfavours the 6th district with its exemplary Hudson Street. Yet, even with this data now available, still little can be said about a simple correlation that explains its unfavourable position in this chart.
Conclusion
From one 1958 statistic about crime in selected U.S. cities, highlighting one city's high crime rate, a leap of faith was made: thinning must be, at least partly, responsible for this rate. From there, another leap ascertained that the same rule applies to suburban districts. Supported by anecdotal evidence only, this rule quickly morphed into orthodoxy (and now a moralism): Cities are "good" and suburbs are "bad" for safety, and thinning accounts for the difference. But credible science demands more than anecdotal evidence when dealing with complex phenomena.
As we saw, robust tabulations of cities, metropolitan areas, and districts within cities show the opposite. Metropolitan regions, whose central cities register high crime rates, display lower average metropolitan rates thanks to the reduced rates of their suburbs and exurbs. Thinner districts are generally safer.
Suburbs have been shown to increase driving and, consequently, a higher rate of traffic crashes. A host of other negative outcomes of city expansion have been studied and shown to prevail.
But one thing we cannot doubt—now in evidence: suburbs do provide greater safety from crime to their residents.
Sources:
1. Chapter 2 – The Death and Life of Great American Cities by Jane Jacobs
2. Murders in the US cities: https://www.americanviolence.org/map?
3. List of US cities by crime rate (2009): https://en.wikipedia.org/wiki/List_of_United_States_cities_by_crime_rate
4. Associations between Urban Sprawl and Life Expectancy in the United States. Shima Hamidi ,
Reid Ewing, Zaria Tatalovich, James B. Grace and David Berrigan
https://www.ncbi.nlm.nih.gov/pubmed/29701644
5. City and Suburban Crime Trends in Metropolitan America: Elizabeth Kneebone and Steven Raphael Analysis of FBI Uniform Crime Report and U.S. Census Bureau data from 1990 to 2008 in the cities, towns, and counties of the 100 largest U.S. metropolitan areas - https://gspp.berkeley.edu/assets/uploads/research/pdf/0526_metropolitan_...
Fanis Grammenos is the director Urban Pattern Associates in Ottawa, Ontario and the author of Remaking the City Grid: A Model for Urban and Suburban Development. Reach him by email at [email protected] with questions or comments.
Photo Credit: BlastOButter42 at English Wikipedia [GFDL or CC BY 3.0-2.5-2.0-1.0]


