America’s demography tells not one story, but many. People concerned with looking at long-term trends need to familiarize themselves with these realities – and also consider whether these will continue in the coming decades.
Losers and Winners
It’s common to read about rapidly growing places, but what about those that are losing? Perhaps it’s fitting in this time of economic decline first to tell the story of areas of loss of population, of out-migration and of natural decrease, more deaths than births. Such areas are not of course necessarily “losers.” They may be prosperous, with a high quality of life; they are just not “growing.”
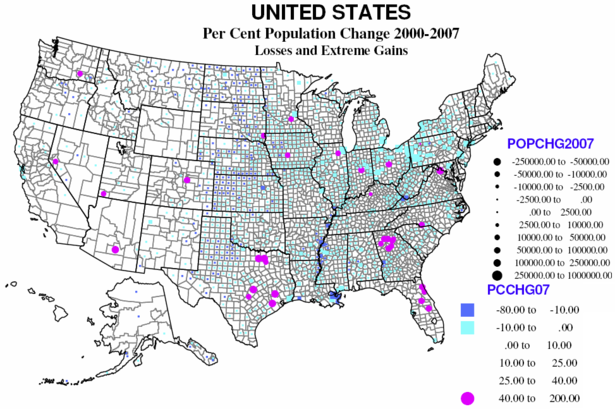
The map below shows the 40 percent of counties which lost population, 2000-2007. 216 lost more than 10 percent, and 1139 lost up to 10 percent. These contrast the 33 counties which grew more than 40 percent in these seven years. So overall, well over half the territory of the country lost population. The largest population losses, by far, were in and around New Orleans (Katrina), followed by the metropolitan cores of the Rust Belt axis from Pittsburgh, through Cleveland to Detroit, and extending west into Indiana, and east through Pennsylvania and western New York.
The largest contiguous area of counties with losses remains the same as it was in the 1970s, 1980s and 1990s: the “high plains” from Mexico to Canada (actually continuing in Canada). Probably 90 percent of counties lost population, especially in Kansas, Nebraska and North Dakota, and extending into the Midwest agricultural heartland of Iowa, northern Missouri, southern Minnesota and western Illinois.
Other traditional areas of losses which continue from the 1970s through 1990s include the coal counties of Appalachia (Kentucky, West Virginia), and the “Black Belt” from Arkansas and Louisiana through the Mississippi Delta and on through parts of Alabama, Georgia, South and North Carolina into Virginia.
Again repeating past patterns are losses in some of the large core counties of Megalopolis, as Philadelphia and Baltimore, and elsewhere (St. Louis, Chicago, Minneapolis and even San Francisco). The highest rates of loss were again in and around New Orleans, small counties in Mississippi and Nevada, and Montana, North and South Dakota.
The 33 rapidly growing counties are ALL suburban except for the new metropolitan area of St. George, Utah. Suburban Atlanta dominates, followed by northeastern Florida, and selected suburbs of Columbus, OH, Indianapolis, Charlotte, Chicago, Minneapolis, Washington, DC, Des Moines, Denver, Reno, Houston, Dallas, and Austin. The largest absolute gains (many areas are now hurting economically) were Maricopa (Phoenix), Harris (Houston), Riverside and San Bernardino, Clark (Las Vegas), Los Angeles, and suburbs of Dallas and San Antonio.
Migration
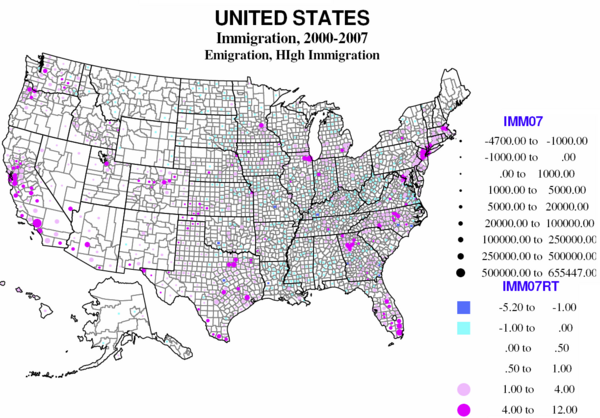
Immigration dominates the news, but there is also emigration, and the difference between these is 'net' international migration. Data on immigration and emigration are not very certain or reliable, as people leaving don’t have to tell anyone, and many entering are equally reticent. Yet there is a clear pattern from the map of the 416 counties. Overall the areas of net loss tend to be the same as for losses in overall population.
Counties where immigrants greatly exceed emigrants are both the core counties of the largest metropolitan areas and their largest suburban counties, but especially in the west, Texas, Florida, and the Atlantic coast metropolitan cores from Atlanta to Boston, California, Texas, Florida, and metropolitan New York city. Mexican immigration is the largest, but there is significant immigration from the rest of Latin America, from Asia and from Eastern Europe. Most of the immigrant destinations are metropolitan, but include some rural small town areas, typically with food processing, an industry dependent on low wage immigrants (TX, AR, OK, KS, NE, IA).
Largest absolute gains are to Los Angeles, Cook, New York City, Miami, Houston, Dallas, Orange County, Phoenix and Santa Clara, with a bias to the southwest, Florida and New York City. The highest immigration rates are in part the same, Miami, Queens, Hudson NJ, Santa Clara, but high rates also characterize Washington DC suburbs, two Kansas counties (food processing), and a Colorado county (workers for ski resorts).
Significant numbers of non-immigrants also move, and as many as a third probably crossed county lines since 2000. In much of America the balance between in and out migration is close, but for many regions, “net” migration is the most important component of change.
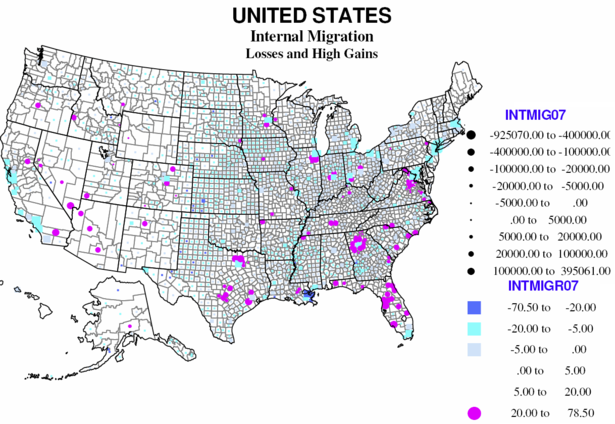
Overall two thirds of American counties reported a net loss from internal migration, 29 at a level more than 20 percent of the base population. Only 118 have high rates of net in-migration (over 20 percent). Large absolute losses characterize most large metropolitan core counties, including coastal California, Dallas, Miami, New Orleans, megalopolis core counties (from Maryland to Massachusetts), and the Great Lakes and Midwest. Smaller absolute net out-migration prevails over most rural small-town America, especially the Great Plains, and agricultural Midwest and Great Lakes, the Black Belt across the south, and includes much of the southwest.
Internal domestic migration represents a distinctive geography. In the west many were inland smaller metropolises, as well as many rural small town environmentally attractive counties that received many of the out-migrants from the large coastal metropolises. In the Midwest and northeast gains were strongly suburban (often local flows from the core counties). In the south rapid gains continued to dominate much of Florida, and metropolitan suburbs, especially around Washington DC, Atlanta, Dallas, and Austin-San Antonio, fueled both by continuing in-region rural to urban flows and by migration from the north to the south.
The losses include the usual suspects, the core counties of the largest metro areas, including Dallas, Miami, and Orange counties, with the native-born displaced to the suburbs and beyond. The largest absolute gains include some central counties, like Maricopa and Clark (but which are also themselves suburban), major suburban counties of Los Angeles, Dallas, Houston, Phoenix, Chicago, and a newcomer, Wake county NC (Raleigh). The highest rates of net in-migration are mostly suburban, Atlanta, Dallas, Washington DC, Denver, Chicago, but also a few smaller counties, as in Pennsylvania and South Dakota.
The Role of Natural Increase
One of the indicators of diversity in America is the remarkable variation in the role of natural increase (or decrease) – that is the difference between births and deaths in an area – in the story of population change.
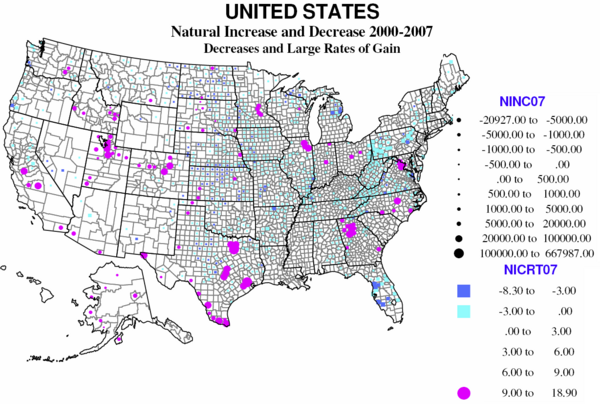
Almost 30 percent of US counties experience natural decrease, and only a little over 10 percent (337) have high rates of natural increase (6% or more growth in 7 years). Natural decrease is mainly a function of age structure, where the young of child-raising age have left, OR where unusual numbers of the elderly have moved in, dominating the population.
There are four distinct regions of natural decrease. The largest, absolutely and relatively, is Appalachia, from extreme northern Georgia, through smaller parts of Tennessee and North Carolina, western Virginia, most of West Virginia, and both the greater Pittsburgh and the Scranton-Wilkes Barre region of northeastern Pennsylvania. Much is a historic region of coal (and steel) production, and often poor transport links to the rest of country. The region has suffered loss of the young, often for 40 years or more.
The second large region of natural decrease is entirely different in character, namely mid-Florida, centered on Tampa-St, Petersburg and Sarasota, as a result of the aging in place of massive numbers of retirees from the north moving to Florida over the last 50 years.
The third region is much more extensive, covering most of the Great Plains and rural Midwest, from Texas and Arkansas to the Dakotas, Minnesota and Montana, regions again suffering long-term loss of the young population to greater opportunities in the city.
The last smaller region is the Michigan-Wisconsin upper peninsula, where losses can be traced to the result of declining mining and forestry. Counties in New Mexico, Arizona, and northern California are somewhat like Florida with large numbers of retirees, while those in coastal Oregon and Washington are in part like upper Michigan, but with many retirees as well.
The 112 counties where births greatly exceed deaths, not surprisingly, reflect a very different geography. They do represent, as is often pointed out, a shift to metropolitan areas but importantly not to the core cities but the suburban hinterlands. Most prominent areas of high natural increase are primarily suburban areas around metropolitan Houston, Dallas, San Antonio, Atlanta, Washington DC, Chicago, Minneapolis and Raleigh, NC. Many of these areas are also affected by in-migration of Hispanic families.
The other reason for high natural increase is higher fertility – families with above replacement numbers of children, often for reasons of religion or ethnicity, and also reinforced by in-migration of young adults. On the map, Native American Indian reservations stand out, as in North and South Dakota, Wisconsin, Montana, and Alaska, although these numbers are still slow. Mormon Utah and Idaho demonstrate high fertility, family size and shares of births, in rural as well as urban counties. But the dominant area of high natural increase is clearly the extensive southwestern region of Mexican heritage and in-migration over recent decades, in Texas, California, Colorado, New Mexico, Arizona, and eastern Washington, plus selected counties in the high plains, e.g., Kansas and Oklahoma. The final bastions for young families and higher natural increase are military dominated counties, as in Georgia, North Carolina and Kansas.
In absolute losses, parts of Florida and Pennsylvania and the northern Great Plains stand out. Relative gains are highest in Hispanic, Native American Indian and Mormon counties. These are impressive numbers – the surplus of births over deaths as a share of the total population.
Why the Differences?
What makes counties lose or gain people? The US has a diverse and restless population. Counties vary greatly in attractiveness to immigrants from abroad or migrants from other states, broadly because of real or perceived “opportunities,” characteristics of jobs or amenities which may lure migrants from less competitive or attractive areas.
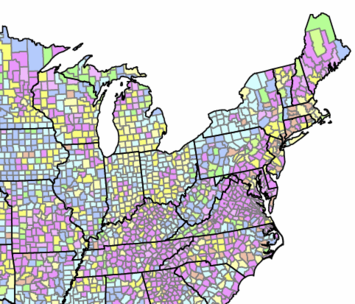
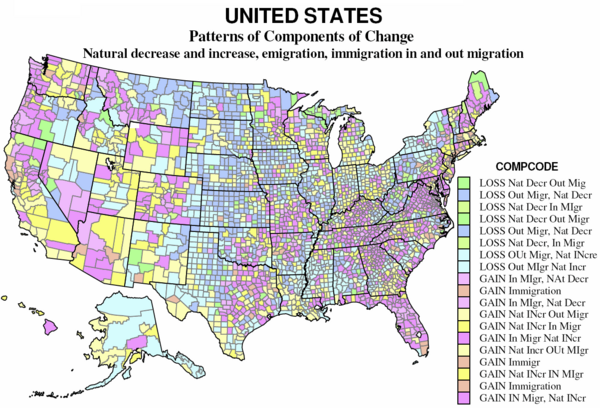
The map divides the counties into nine sets, based on the relative importance of natural increase or decrease, emigration and immigration and in-migration and out-migration. The 1439 counties which lost population include 165 for which the main reason for loss is from natural decrease; of these one subgroup lost overall despite net immigration, the other’s loss was aggravated by net out-migration as well. The larger set of counties with population losses, 1184, are those for which the loss is mainly attributable to net out-migration, with two subgroups, one with loss despite natural increase, the other with loss magnified by natural decrease.
On the map the “darker” green counties (89) had a large natural decrease and a smaller net out-migration; the “lighter” green (76) had natural decrease, exceeding a smaller net in-migration. These counties for which natural decrease dominates are scattered across the Great Plains from Texas to Canada, together with clusters from Appalachia (VA, WV, PA, and NY), northern MI-WI, and a few declining natural resource areas in the west.
The “darker” blue counties (486) are dominated by net out-migration, but also had natural decrease. The “lighter” blue counties (698) had natural increases but these were much exceeded by net out-migration. These counties are often interspersed with the “green” counties, dominated by natural decrease. These 1184 counties – over one-third of counties and of US territory – constitute a large swath of the Plains and Midwest, large parts of New York and Pennsylvania, the coal counties of Kentucky and West Virginia, and the “Black Belt” across the south from Louisiana and Arkansas to southern Virginia. Finally they include sparsely populated resource counties in Alaska and parts of the west. Overall, the counties losing population tend to be non-metropolitan and interior, except for the declining industrial metropolitan counties of the “Rust Belt”.
Gainers
The gaining counties consist of three broad groups — 755 for which natural increase is the main contributor to growth, with subsets of 420 growing despite net out-migration, and 335 with net in-migration as well. The second consists of 104 counties for which immigration is the predominant basis for growth. Finally there are 933 counties for which net in-migration is the main contributor to growth, with subsets with natural decrease with natural increase.
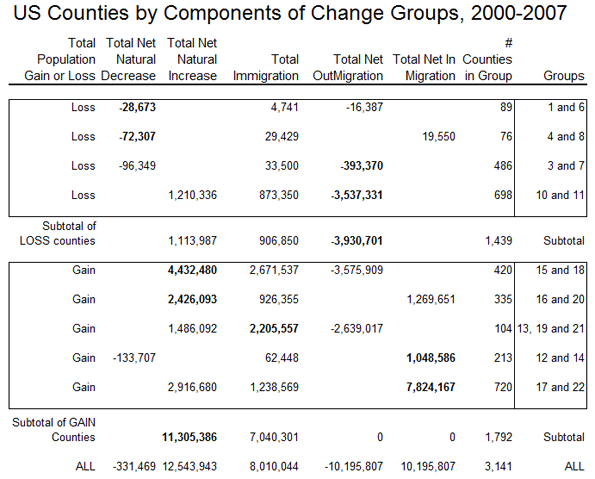
The “yellow” counties (755) gained population mainly because of natural increase; the light yellow counties (420) grew despite often substantial net out-migration; the darker yellow counties (335) also had a smaller net in-migration, and are thus among the more ”successful” more rapidly growing US counties. The former are especially prevalent in cities of the west – e.g. Los Angeles, San Diego, Houston, Dallas – with sizable immigrant populations (see the table) and higher fertility and displacement of the native-born, but yellow counties are also common in non-metropolitan and small metropolitan and suburban areas of the Great Lakes states, the outer Megalopolis, and urban industrializing parts of the south. The “dark” yellow areas are in the same regions, and are very often the areas gaining migrants from the “light” yellow areas, as can be seen in California, Arizona, Utah, Washington and Colorado.
The “orange” counties, only 104, are those where immigration is the main source of growth. These are somewhat scattered, but especially common in New England and Middle Atlantic states, selected counties of the Plains (often with food processing plant growth) and northern Pacific Coast metropolitan regions, as the San Francisco bay region, Portland and Seattle.
The “magenta” counties (933) are those for which net in-migration dominates growth. The lighter magenta for those with natural decrease (213), the darker magenta for those with natural increase as well. All these tend to be the most rapidly growing counties in the country, and tend to occur together. The main difference with counties with natural decrease are those with an older age structure, but which are nevertheless attractive to in-migrants. From the map these occur in two main settings: traditional areas of amenity migration, most obviously covering much of Florida, but also widespread in northern New England, northern Michigan, Wisconsin and Minnesota, the Ozarks, parts of the Tennessee valley, and across much of the west, with particular swaths in western Montana, coastal Oregon and Washington and northern California. The second setting is the exurban environs of major metropolitan areas, where new growth is invading formerly rural areas.
The final, largest set of counties with natural increase as well as high in-migration (720 counties), are the stereotypical winners in the contemporary “growth races” – based on a combination of employment growth and metropolitan or environmental amenities. These tend especially to be southern and western metropolitan areas, small as well as large. The most dominant regions are greater Washington DC, greater Atlanta, Dallas and Houston, Portland, Denver, Phoenix, most of Florida, and – perhaps surprisingly – substantial parts of the north-south borderlands, including Tennessee, Kentucky, Arkansas, Oklahoma, and Missouri.
What about the recession? It’s hard to judge the relative effects of the current severe recession on likely near- or longer-term growth. Clearly, the collapse of housing markets are slowing the growth of such rapidly growing places as Phoenix and Las Vegas, but this does not mean they won’t regain their general attractiveness and economic viability. The particularly severe job losses in the already hurting western Rust Belt will likely aggravate the recent pattern of decline which predated the recession and could get much worse.
Richard Morrill is Professor Emeritus of Geography and Environmental Studies, University of Washington. His research interests include: political geography (voting behavior, redistricting, local governance), population/demography/settlement/migration, urban geography and planning, urban transportation (i.e., old fashioned generalist)


after reading this blog, in
after reading this blog, in my point of view this topic is quite interesting because it provides tips how to take care of our garden or any plant. It is the most vital thing to make our environment pollution free. For living in a hygienic and healthy environment this essential. By following such our farming sectors fulfill the demand of foods. For balancing the need of food and availability these foods in market, increase in production is essential. Fertilizers are best for enhance the growth and productivity of plant. buy kelp
surfing internet
Internet is a tool developed to help learn cooking pizza games through online gaming. They are especially oriented to make children eat all those cuisines which they hate to even look at otherwise and for thoses children who like magic Games can surfing internet,too!
the most amazing things
One of the most amazing things about the online food games is that they cost you nothing at all, also no matter how many times you wish to play a shopping games, you can simply get online and play it without worrying about money.Also if you don’t know how to take care your baby as a young mother, you can play baby games online,too!
You might even coach your puppy for exhibit!
Participate in having a puppy animal dog Games or barbie stand by Cars Games in a car show to do with them similarly in actual life, You might even coach your puppy for exhibit!
make her happy
Dora is so cutie and make you want to touch her head and make her happy,now you have the chance to play dora games to dress this lovely girl up and make her much pretty then.barbie dress up Games