
The 2021 edition of Demographia World Urban Areas includes current population estimates for the 985 identified built-up urban areas (Note 1 describes the background and methodology) with at least 500,000 population.This is a smaller number than last year, due to a methodology that rendered somewhat lower populations for some urban areas. Demographia World Urban Areas has largely converted (80%) to estimates based on the 250-meter grid square population estimates from the European Commission Global Human Settlement (GHS2015) 250-meter database.
The 500,000 and over urban areas have a combined population of 2.24 billion, about 51.4% of the world’s urban population or 28.9% of the combined world urban and rural population.
The Megacities
The most populous urban areas are the 36 megacities, each with more than 10 million residents. Megacities receive outsized attention due to their influence in media, finance and tourism, but they have only 14.8% of the urban population and 8.3% of the world population. The other urban areas in Demographia World Urban Areas (between 500,000 and 10 million) account for 20.5% of the world population, while smaller urban areas have 27.3% and rural areas 43.9% (Figure 1).
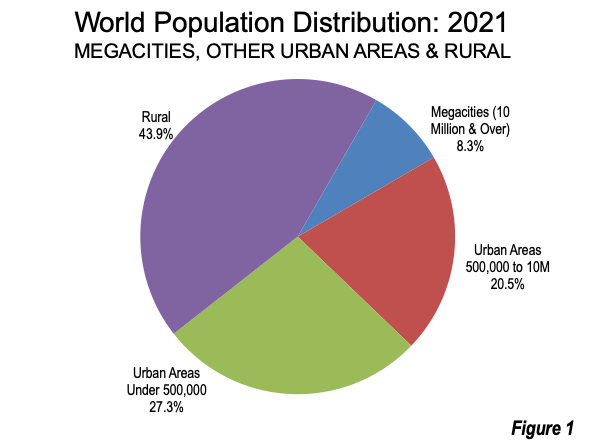
Figure 2 shows the 2021 estimated population for the megacities. The three largest megacities are considerably larger than the others. Tokyo continues its lead as the world’s largest urban area, with 39.1 million residents.Tokyo has been ranked as the world’s largest urban area since 1955, a 75 year record that falls somewhat short of London’s century long primacy, but is more than double the three decade reign of New York (below).
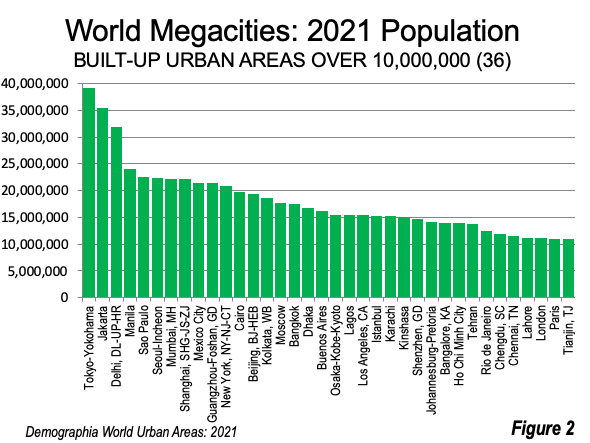
Tokyo holds a nearly 10% lead over second ranked Jakarta, at 35.4 million. Population estimates for the Jakarta urbanhave usually not reflected the entire built-up urban area (Note 2: Underestimation of urban area densities), Jakarta is nearly 10% larger than third ranked Delhi (31.9 million), which has emerged over the last decade as India’s largest, now holding a 10 million (30%) lead over perennial leader Mumbai.
There is a much larger 25% gap between Delhi and fourth ranked Manila (24.0 million), an urban area that, like Jakarta, has often had its population substantially under reported (Note 2). Manila is six percent larger than fifth ranked Sao Paulo, with a population of 22.5 million), which is South America’s largest urban area as well as in the Western Hemisphere.
From sixth rank on, the margins between adjacently ranked urban areas is smaller. The population gap between fifth ranked Sao Paulo and tenth ranked Guangzhou-Foshan is less than five percent. Seoul, ranked sixth with 22.4 million has also been characterized by other sources as having a much smaller population (Note 2).
Mumbai, which some predicted would become the world’s first or second largest urban area, ranked well below that, at 7th in 2021. Mumbai’s 2021 population was a full three million short of a 2020 forecast made in the mid-2000s.
Shanghai is eighth, with 22.1 million. This is well below the United Nations 2020 projection made mid-decade (27 million), population growth was virtually stopped by public policy. The Guardian attributes “gentrification” to be a major cause both in Shanghai and Beijing (below), as lower income areas are redeveloped with newer, less dense housing.
Mexico City, another urban area that had been predicted to become the world’s largest had been forecast before 1980 to reach 31 million residents by 2000. Yet, Mexico City’s 2021 population is only 21.5 million and still ranks only 9th largest in the world.
Guangzhou-Foshan continues to grow strongly and is now estimated to be China’s second largest urban area and 10th largest in the world at 21.5 million. New York, which was the world’s largest urban area for about three decades (starting in the 1920s). ranks 11th, at 20.9 million. New York is a combined urban area that includes the continuous urbanization stretching to New Haven, Connecticut.
Cairo, at 19.7 million ranks 12th and is the largest urban area in Africa. Beijing ranks 13th, with 19.4 million and like Shanghai, had its population growth slow due to population control policies.Beijing had been the world’s largest agglomeration in the early 19th century, and reached one million residents at that time.
Kolkata, which had been India’s largest urban area until 1975, ranked 14th, at 17.8 million. Moscow ranked 14th has 17.7 million, and is the largest urban area in Europe.
Los Angeles ranked 21st, at 15.5 million, dropped out of the top 20 for the first time since before 1950. Los Angeles stood as 12th in 1950, and reached as high as 6th largest from 1965 to 1975. London, with all of the urban area inside the greenbelt (urban growth boundary), has been growing in recent years and achieved megacity status for the first time. London ranks 34th and has a population of 11.2 million, having replaced #35 Paris as the largest urban area in Western Europe. London had been the world’s largest agglomeration for about 100 years to the 1920s.
Highest and Lowest Megacity Densities
Megacity urban population densities (Figure 3) range from a high of 36,900 per square kilometer in Dhaka (95,700 per square mile) and Kinshasa (Democratic Republic of the Congo) at 33,200 per square kilometer (83,600 per square mile) to the least dense megacity (Figure 2, above), New York, at 1,700 per square kilometer (4,500 per square mile). In recent years, considerable peripheral development has been occurring in Dhaka, which used to have a population density well above 40,000 per square kilometer (100,000 per square mile).
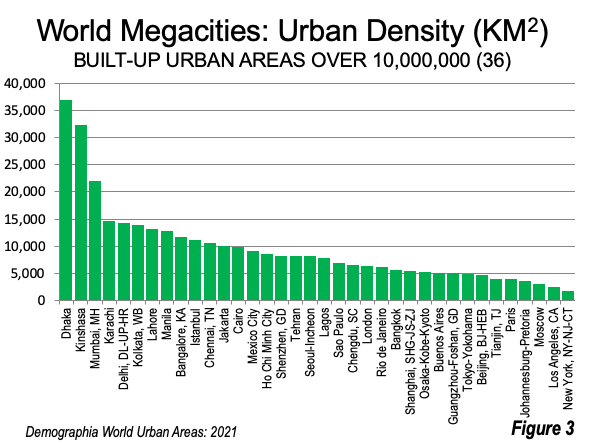
Seoul has the highest urban population density among the high-income megacities, at 8,100 per square kilometer (20,900 per square mile). The highest density urban areas in the high income world are in China, Macau (27,300 per square kilometer or 70,600 per square mile) and Hong Kong (25,500 per square kilometer or 66,100 per square mile).
Largest and Smallest Urban Footprint (Urban Land Area)
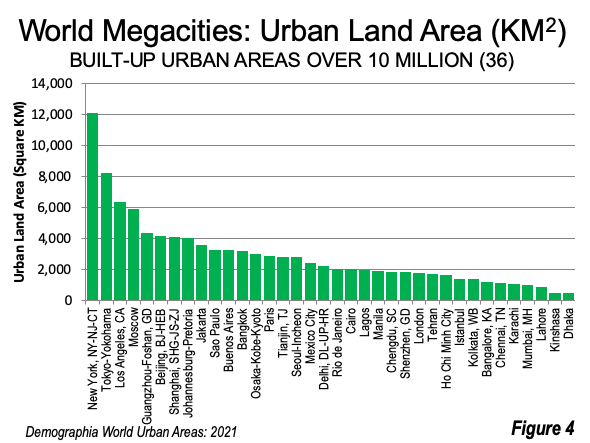
New York --- often seen as the epitome of dense urbanism --- in reality has the largest urban footprint of any built-up urban area, covering 12,100 square kilometers (4,700 square kilometers). New York covers nearly 50 percent more land area than much larger Tokyo-Yokohama and 90 percent more land area than Los Angeles and 27 times the land area of Dhaka.
Dhaka has smallest urban footprint, at 456 square kilometers (176 square miles), followed closely by Kinshasa, with 466 square kilometers and 180 square miles (Figure 4).
Disruptions: The Pandemic and Remote Work
There are reports that the Covid-19 pandemic has severely impacted large urban areas, with many households relocating to smaller urban areas elsewhere or nearer the urban fringe. Much of this has to do with the rise of remote work, the practicality of which was proven by its success, and muted the economic losses that would have occurred had remote workers lost their jobs rather than continuing to work. In the years to come, pandemic related disruptions to the world’s largest urban areas will become clearer. We will continue to follow these developments.
Description of Tables
Demographia World Urban Areas contains five tables that provide summary and ranking information:
Schedule 1: World Summary: Built-Up Urban Areas Over 500,000
Schedule 2: Largest Built-Up Urban Areas in the World
Schedule 3: Built-Up Urban Areas Ranked by Land Area (Urban Footprint)
Schedule 4: Built-Up Urban Areas Ranked by Urban Population Density
Schedule 5: Alphabetical List of Built-Up Urban Areas
Note 1: Demographia World Urban Areas is in its 17th year of publication. It was established to provide consistency to the estimation of urban density, in the all too frequent erroneous anecdotal data. The built-up urban area is the only level at which there is sufficiency consistency and sufficient data to estimate the densities of the urban organism at anything approximating international standards.
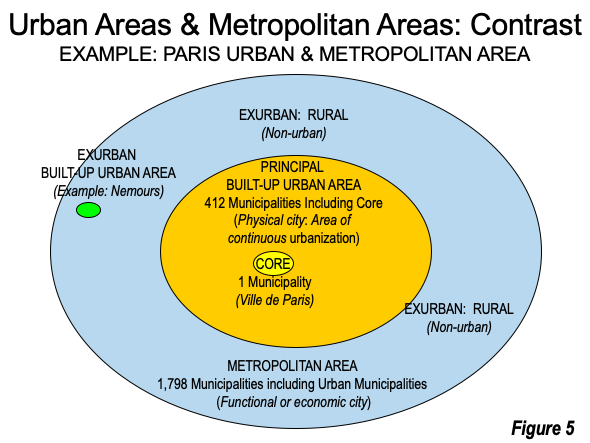
There continues to be considerable confusion about the measurement of urban densities. The key is in comprehending the differences between urban areas and metropolitan areas. Built-up urban areas are continuously built-up development that, by definition excludes rural lands (all of the world’s land is either in urban areas or rural). This is illustrated by the Paris built up urban area and the Paris metropolitan area in Figure 5. Built-up urban areas are the city in its physical form, as opposed to metropolitan areas, which are the economic or functional cities (the labor and housing markets). These terms are defined by Cheshire, et al. of the London School of Economics (see: “People rather than places, ends rather than means: LSE economists on urban containment”).
Demographia World Urban Areas uses base year population estimates, principally from the European Commission Global Human Settlement (GHS2015) 250 meter database (grid square estimates). National statistical authority base year estimates are used where identified and consistent with international definitions.These figures are then adjusted to account for population change forecasts, principally from the United Nations and the national statistics bureaus for a current year estimate.
Demographia combines extensions of continuously built-up areas, where they are a part of a larger labor market (such as New York, Bridgeport-Stamford and New Haven, Los Angeles, Riverside-San Bernardino and Mission Viejo and Toronto, Hamilton and Oshawa).
Demographia World Urban Areas is a continuing project providing “state of the art” data. Revisions are made as more accurate satellite photographs and population estimating resources become available. As a result, Demographia World Urban Areas is not intended for trend analysis.
Note 2: Underestimation of urban area populations: Demographia World Urban Areas was the first to identify the under-estimation of population in some of the largest urban areas, by other sources. For example, Demographia’s early population estimates for the Jakarta, Delhi, Manila, Seoul-Incheon and Kuala Lumpur built-up urban areas were far higher than reported by others at the time. Other sources have revised their estimates upward. The earlier, lower estimates of others were, in actuality, municipal estimates that did not sufficiently take into consideration the spread of urbanization beyond city or other geographical limits. Demographia’s larger population estimates resulted from satellite map examination to determine the extent of individual built-up urban areas.
Wendell Cox is principal of Demographia, an international public policy firm located in the St. Louis metropolitan area. He is a founding senior fellow at the Urban Reform Institute, Houston, a Senior Fellow with the Frontier Centre for Public Policy in Winnipeg and a member of the Advisory Board of the Center for Demographics and Policy at Chapman University in Orange, California. He has served as a visiting professor at the Conservatoire National des Arts et Metiers in Paris. His principal interests are economics, poverty alleviation, demographics, urban policy and transport. He is co-author of the annual Demographia International Housing Affordability Survey and author of Demographia World Urban Areas.
Mayor Tom Bradley appointed him to three terms on the Los Angeles County Transportation Commission (1977-1985) and Speaker of the House Newt Gingrich appointed him to the Amtrak Reform Council, to complete the unexpired term of New Jersey Governor Christine Todd Whitman (1999-2002). He is author of War on the Dream: How Anti-Sprawl Policy Threatens the Quality of Life and Toward More Prosperous Cities: A Framing Essay on Urban Areas, Transport, Planning and the Dimensions of Sustainability.
Photograph: Cover, 17th Annual Demographia World Urban Areas: Buenos Aires: Retiro Railway Station with the Rio de la Plata in the background (by author)


