
One of the most frequently recurring justifications for densification policies (smart growth, growth management, livability, etc.) lies with the assumption that the automobile-based mobility system (Note 1) disadvantages lower income citizens. Much of the solution, according to advocates of densification is to discourage driving and orient both urbanization and the urban transportation system toward transit as well as walking and cycling.
Of course, there is no question but that lower income citizens are disadvantaged with respect to just about everything economic. However, there are few ways in which lower income citizens are more disadvantaged than in their practical access to work and to amenities by means of transit, walking and cycling. Indeed, the impression that lower income citizens rely on transit to a significantly greater degree than everyone else is just that – an impression.
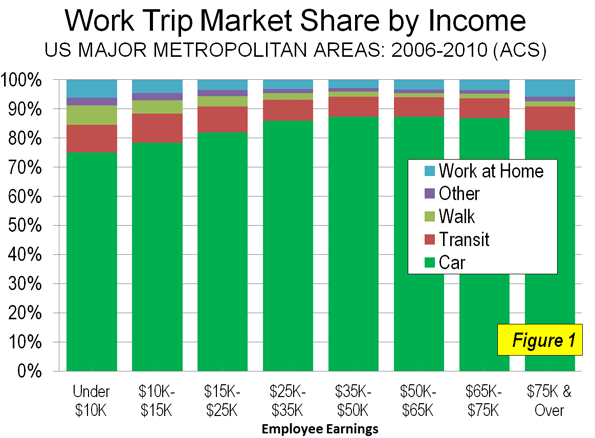
The Data: This is illustrated by a compilation of work trip data from the five-year American Community Survey for 2006 to 2010. In the nation's 51 major metropolitan areas (more than 1,000,000 population), 76.3% of lower income employees use cars to get to work, three times that of all other modes combined (Figure 1).
Admittedly, this is less than the 83.3% of all employees who use cars for the work trip, but a lot more than would be expected, especially among those who believe that transit is the principal means of mobility for low income citizens. Overall, 8 times as many lower income citizens commuted by car as by transit. In this analysis, lower income citizens are defined as employees who earn less than $15,000 per year, which is approximately one-half of the median earnings per employee of $29,701. .
Perhaps most surprising is the fact that only 9.6% of lower income citizens used transit to get to work. This is not very much higher than the 7.9% of all workers in the metropolitan areas who use transit. (Table 1).
| Table 1 | ||||
| Work Trip Market Share: 2006-2010 | ||||
| Lower Income Employees and All Employees | ||||
| Metropolitan Areas Over 1,000,000 Population | ||||
| Lower Income Employees | ||||
| All Employees | Market Share | Employees Earning Under $15,000 Annually | Market Share | |
| Car, Truck & Van: Alone | 56.72 | 73.4% | 9.56 | 63.1% |
| Car, Truck & Van: Carpool | 7.67 | 9.9% | 2.00 | 13.2% |
| Car, Truck & Van: Total | 64.38 | 83.3% | 11.56 | 76.3% |
| Transit | 6.14 | 7.9% | 1.46 | 9.6% |
| Walk | 2.19 | 2.8% | 0.89 | 5.9% |
| Other (Taxi, Motorcyle, Bicycle & Other) | 1.34 | 1.7% | 0.39 | 2.6% |
| Work At Home | 3.24 | 4.2% | 0.85 | 5.6% |
| Total | 77.29 | 100.0% | 15.16 | 100.0% |
| In Millions | ||||
| Note: Median Earnings: $29,701 | ||||
| Source: American Community Survey: 2006-2010 | ||||
Transit's small market share has to do with its inherent impracticality as a means of getting to most employment. According to ground-breaking research by the Brookings Institution, low-income citizens could reach only 35 percent of jobs in the major metropolitan areas by transit in 90 minutes. In other words, you cannot get from here to there, at least for most trips. It is no more reasonable for lower income citizens to spend three hours per day commuting than it is for anyone else. A theoretical 90 minute one-way standard is no indicator of usable mobility. It is likely that only about 8 percent of jobs are accessible by lower income citizens in 45 minutes (Note 2) and 4 percent in 30 minutes.
Automobility: Among the major metropolitan areas, lower income citizens use automobiles to get to work most in Birmingham (90.6%). Fourteen other metropolitan areas have lower income automobile market shares of 85% or more, including Charlotte, Detroit, Dallas-Fort Worth, Indianapolis, Jacksonville, Kansas City, Louisville, Memphis, Nashville, Oklahoma City, Raleigh, San Antonio, St. Louis and Tampa-St. Petersburg. As in all things having to do with urban transportation, there are two Americas: New York and outside New York. By far the lowest automobile market share for low income citizens is in New York, at 49.3%. The second lowest lower income automobile market share is in San Francisco-Oakland, at 63.1%. Washington and Boston are also below 70% (Table 2).
| Table 2 | ||||
| Work Trip Market Share: Car, Truck or Van: 2006-2010 | ||||
| Lower Income Employees and All Employees | ||||
| Metropolitan Areas Over 1,000,000 Population | ||||
| Lower Income Employees | ||||
| Metropolitan Area | All Employees | Employees Earning Under $10,000 | Employees Earning $10,000-$14,999 | All Under $15,000 (Combined) |
| Atlanta, GA | 88.3% | 82.1% | 83.8% | 82.8% |
| Austin, TX | 87.2% | 77.8% | 82.3% | 79.5% |
| Baltimore, MD | 85.9% | 73.8% | 77.7% | 75.1% |
| Birmingham, AL | 94.6% | 89.3% | 92.6% | 90.6% |
| Boston, MA-NH | 77.2% | 66.4% | 73.4% | 68.5% |
| Buffalo, NY | 89.7% | 79.8% | 84.3% | 81.3% |
| Charlotte, NC-SC | 90.9% | 85.3% | 88.5% | 86.4% |
| Chicago, IL-IN-WI | 80.0% | 73.0% | 77.0% | 74.4% |
| Cincinnati, OH-KY-IN | 91.2% | 82.7% | 87.9% | 84.4% |
| Cleveland, OH | 87.3% | 78.1% | 84.3% | 80.3% |
| Columbus, OH | 90.8% | 80.3% | 87.1% | 82.6% |
| Denver, CO | 85.3% | 76.9% | 82.1% | 78.9% |
| Detroit. MI | 93.1% | 85.8% | 89.9% | 87.2% |
| Dallas-Fort Worth, TX | 91.5% | 85.4% | 88.7% | 86.7% |
| Hartford, CT | 89.7% | 76.8% | 83.1% | 78.8% |
| Houston. TX | 90.7% | 83.6% | 86.4% | 84.7% |
| Indianapolis, IN | 92.6% | 85.1% | 90.2% | 86.9% |
| Jacksonville, FL | 91.6% | 85.4% | 88.3% | 86.5% |
| Kansas City, MO-KS | 90.6% | 85.2% | 87.6% | 86.2% |
| Los Angeles, CA | 84.7% | 70.8% | 74.1% | 72.2% |
| Las Vegas, NV | 89.7% | 80.0% | 82.4% | 81.0% |
| Louisville, KY-IN | 92.4% | 85.6% | 87.6% | 86.3% |
| Memphis, TN-MS-AR | 93.3% | 85.0% | 89.6% | 86.7% |
| Miami, FL | 88.3% | 79.0% | 80.9% | 79.9% |
| Milwaukee, WI | 89.3% | 78.0% | 83.5% | 79.8% |
| Minneapolis-St. Paul, MN-WI | 86.8% | 76.9% | 81.1% | 78.2% |
| Nashville, TN | 92.0% | 86.8% | 89.5% | 87.8% |
| New Orleans, LA | 90.0% | 80.9% | 83.8% | 82.0% |
| New York, NY-NJ-PA | 57.6% | 50.0% | 48.1% | 49.3% |
| Oklahoma City, OK | 93.1% | 86.8% | 90.8% | 88.2% |
| Orlando, FL | 89.6% | 79.7% | 86.1% | 81.8% |
| Pittsburgh, PA | 86.2% | 77.9% | 81.8% | 79.2% |
| Philadelphia, PA-NJ-DE-MD | 82.1% | 70.6% | 76.2% | 72.4% |
| Phoenix, AZ | 88.6% | 80.5% | 83.9% | 81.8% |
| Portland, OR-WA | 81.6% | 69.3% | 75.1% | 71.3% |
| Providence, RI-MA | 89.9% | 79.9% | 87.1% | 82.3% |
| Raleigh, NC | 90.8% | 84.0% | 88.0% | 85.4% |
| Rochester, NY | 89.9% | 76.7% | 87.0% | 80.0% |
| Riverside-San Bernardino, CA | 90.6% | 83.4% | 87.1% | 84.8% |
| Richmond, VA | 91.3% | 83.2% | 86.2% | 84.2% |
| Sacramento, CA | 90.7% | 80.8% | 86.3% | 82.9% |
| San Antonio, TX | 92.1% | 85.7% | 88.2% | 86.6% |
| San Diego, CA | 85.9% | 73.6% | 79.9% | 76.0% |
| Seattle, WA | 81.3% | 72.4% | 76.1% | 73.7% |
| San Francisco-Oakland, CA | 72.4% | 63.3% | 63.4% | 63.3% |
| San Jose, CA | 87.1% | 74.3% | 80.2% | 76.4% |
| Salt Lake City, UT | 88.1% | 79.6% | 83.4% | 81.0% |
| St. Louis, MO-IL | 91.1% | 83.8% | 88.6% | 85.4% |
| Tampa-St. Petersburg, FL | 90.1% | 84.1% | 87.6% | 85.5% |
| Virginia Beach-Norfolk, VA-NC | 89.8% | 81.9% | 81.8% | 81.9% |
| Washington, DC-VA-MD-WV | 77.1% | 67.8% | 71.4% | 69.0% |
| Total: 51 Metropolitan Areas | 83.3% | 75.1% | 78.3% | 76.3% |
| New York | 57.6% | 50.0% | 48.1% | 49.3% |
| Outside New York | 86.5% | 77.8% | 81.8% | 79.3% |
| Average of Metropolitan Areas | 87.7% | 78.9% | 83.0% | 80.4% |
| Median | 89.7% | 80.0% | 84.3% | 81.8% |
| Maximum | 94.6% | 89.3% | 92.6% | 90.6% |
| Minimum | 57.6% | 50.0% | 48.1% | 49.3% |
| Note: Median Earnings: $29,701 | ||||
| Source: American Community Survey: 2006-2010 | ||||
Transit: It’s not surprising that New York has by far the highest transit market share among lower income commuters. However, New York's lower income transit market share is only marginally higher than its market share among all commuters, at 31.5%, compared to 30.0% for the entire workforce. San Francisco-Oakland had the second highest lower income transit market share at 16.8%. Boston, Chicago, Philadelphia and Washington were also above 10%. The lowest transit market share among lower income citizens was 1.1% in Oklahoma City. Six other metropolitan areas had lower income transit market shares under 2.5%, including Birmingham, Indianapolis, Jacksonville, Nashville, Raleigh and San Antonio (Table 3).
| Table 3 | ||||
| Work Trip Market Share: Transit: 2006-2010 | ||||
| Lower Income Employees and All Employees | ||||
| Metropolitan Areas Over 1,000,000 Population | ||||
| Lower Income Employees | ||||
| Metropolitan Area | All Employees | Employees Earning Under $10,000 | Employees Earning $10,000-$14,999 | All Under $15,000 (Combined) |
| Atlanta, GA | 3.4% | 5.6% | 6.2% | 5.8% |
| Austin, TX | 2.6% | 5.9% | 5.3% | 5.6% |
| Baltimore, MD | 6.3% | 9.8% | 9.3% | 9.6% |
| Birmingham, AL | 0.7% | 1.8% | 1.8% | 1.8% |
| Boston, MA-NH | 11.9% | 12.3% | 13.3% | 12.6% |
| Buffalo, NY | 3.7% | 6.9% | 5.8% | 6.6% |
| Charlotte, NC-SC | 2.0% | 3.5% | 3.1% | 3.3% |
| Chicago, IL-IN-WI | 11.4% | 11.9% | 12.5% | 12.1% |
| Cincinnati, OH-KY-IN | 2.4% | 4.3% | 3.8% | 4.1% |
| Cleveland, OH | 2.7% | 5.3% | 3.1% | 4.5% |
| Columbus, OH | 1.7% | 3.5% | 3.8% | 3.6% |
| Denver, CO | 4.6% | 7.2% | 7.2% | 7.2% |
| Detroit. MI | 1.5% | 3.5% | 3.1% | 3.3% |
| Dallas-Fort Worth, TX | 1.6% | 2.6% | 2.9% | 2.7% |
| Hartford, CT | 2.8% | 5.4% | 5.0% | 5.3% |
| Houston. TX | 2.6% | 4.1% | 4.3% | 4.1% |
| Indianapolis, IN | 1.0% | 2.6% | 1.6% | 2.2% |
| Jacksonville, FL | 1.1% | 2.5% | 2.4% | 2.5% |
| Kansas City, MO-KS | 1.7% | 3.8% | 3.4% | 3.6% |
| Los Angeles, CA | 6.1% | 11.7% | 13.9% | 12.6% |
| Las Vegas, NV | 3.6% | 7.4% | 7.6% | 7.5% |
| Louisville, KY-IN | 2.2% | 4.7% | 3.7% | 4.3% |
| Memphis, TN-MS-AR | 1.3% | 3.3% | 3.1% | 3.3% |
| Miami, FL | 3.7% | 7.9% | 8.3% | 8.1% |
| Milwaukee, WI | 3.7% | 7.7% | 7.4% | 7.6% |
| Minneapolis-St. Paul, MN-WI | 4.6% | 6.4% | 6.4% | 6.4% |
| Nashville, TN | 1.0% | 1.8% | 2.0% | 1.9% |
| New Orleans, LA | 2.5% | 5.0% | 5.3% | 5.1% |
| New York, NY-NJ-PA | 30.5% | 30.0% | 34.0% | 31.5% |
| Oklahoma City, OK | 0.5% | 1.3% | 0.8% | 1.1% |
| Orlando, FL | 3.9% | 7.4% | 5.9% | 6.9% |
| Pittsburgh, PA | 5.8% | 6.2% | 6.4% | 6.3% |
| Philadelphia, PA-NJ-DE-MD | 9.3% | 12.2% | 11.8% | 12.1% |
| Phoenix, AZ | 2.2% | 4.2% | 4.9% | 4.5% |
| Portland, OR-WA | 6.2% | 9.3% | 8.3% | 8.9% |
| Providence, RI-MA | 2.6% | 3.3% | 3.2% | 3.3% |
| Raleigh, NC | 0.9% | 1.9% | 2.1% | 2.0% |
| Rochester, NY | 2.0% | 4.8% | 3.0% | 4.2% |
| Riverside-San Bernardino, CA | 1.6% | 2.7% | 2.3% | 2.6% |
| Richmond, VA | 1.9% | 3.8% | 4.4% | 4.0% |
| Sacramento, CA | 2.2% | 5.1% | 4.6% | 4.9% |
| San Antonio, TX | 1.3% | 2.3% | 2.8% | 2.5% |
| San Diego, CA | 3.3% | 6.9% | 6.1% | 6.6% |
| Seattle, WA | 8.2% | 9.9% | 10.5% | 10.1% |
| San Francisco-Oakland, CA | 14.6% | 15.8% | 18.4% | 16.8% |
| San Jose, CA | 3.3% | 6.1% | 6.0% | 6.1% |
| Salt Lake City, UT | 3.2% | 5.2% | 4.5% | 5.0% |
| St. Louis, MO-IL | 2.6% | 4.8% | 3.4% | 4.4% |
| Tampa-St. Petersburg, FL | 1.4% | 2.9% | 2.3% | 2.7% |
| Virginia Beach-Norfolk, VA-NC | 1.7% | 3.8% | 4.7% | 4.1% |
| Washington, DC-VA-MD-WV | 13.9% | 14.3% | 15.8% | 14.8% |
| Total: 51 Metropolitan Areas | 7.9% | 9.4% | 10.1% | 9.7% |
| New York | 30.5% | 30.0% | 34.0% | 31.5% |
| Outside New York | 5.1% | 7.1% | 7.4% | 7.2% |
| Average of Metropolitan Areas | 4.3% | 6.3% | 6.3% | 6.3% |
| Median | 2.6% | 5.1% | 4.7% | 4.9% |
| Maximum | 30.5% | 30.0% | 34.0% | 31.5% |
| Minimum | 0.5% | 1.3% | 0.8% | 1.1% |
| Note: Median Earnings: $29,701 | ||||
| Source: American Community Survey: 2006-2010 | ||||
Automobile and Transit Metrics: The difference in automobile commuting between all employees and lower income employees turns out to be surprisingly small. The least variation is in Birmingham, where the automobile market share among lower income commuters is 4.3% below that of all commuters. Charlotte, Kansas City and Nashville also have lower income market share variations of less than 5%. The greatest variation is in Los Angeles, where the automobile market share among lower income commuters is 14.7% less than for all commuters. The lower income automobile market share is also at least 12.5% below that of all commuters in Baltimore, New York and Portland.
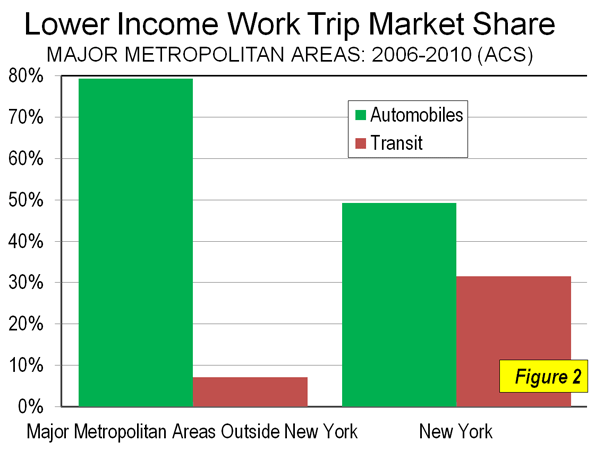
Oklahoma City has the most lower income automobile commuters in relation to transit commuters, with 81.3 times as many lower income commuters using automobiles as opposed to transit. In Birmingham, Nashville and Raleigh, there are more than 40 lower income automobile commuters per transit commuter. In contrast, the number of low-income automobile commuters in New York is 1.6 times that of lower income transit commuters. Again, New York is in a class by itself (Figure 2). Outside New York, there are 11.0 times as many lower income automobile commuters as transit commuters. San Francisco-Oakland (3.8) and Washington (4.7) are the only other metropolitan areas with fewer than five lower income automobile commuters per transit commuter (Table 4).
| Table 4 | ||||
| Work Trip Market Share: 2006-2010 | ||||
| Lower Income Employees and All Employees | ||||
| Metrics: Car, Truck or Van & Transit | ||||
| Metropolitan Areas Over 1,000,000 Population | ||||
| Lower Income Car, Truck or Van Market Share Compared to All | Car Truck or Van Market Share Times Transit | |||
| Metropolitan Area | Employees Earning Under $10,000 | Employees Earning $10,000-$14,999 | All Under $15,000 (Combined) | |
| Atlanta, GA | -7.0% | -5.0% | -6.3% | 14.2 |
| Austin, TX | -10.8% | -5.5% | -8.8% | 14.1 |
| Baltimore, MD | -14.1% | -9.6% | -12.6% | 7.8 |
| Birmingham, AL | -5.6% | -2.1% | -4.3% | 50.7 |
| Boston, MA-NH | -14.1% | -5.0% | -11.2% | 5.4 |
| Buffalo, NY | -11.1% | -6.0% | -9.4% | 12.4 |
| Charlotte, NC-SC | -6.1% | -2.6% | -4.9% | 25.9 |
| Chicago, IL-IN-WI | -8.8% | -3.8% | -7.0% | 6.1 |
| Cincinnati, OH-KY-IN | -9.3% | -3.6% | -7.4% | 20.4 |
| Cleveland, OH | -10.5% | -3.3% | -8.0% | 17.7 |
| Columbus, OH | -11.5% | -4.0% | -9.0% | 23.1 |
| Denver, CO | -9.8% | -3.8% | -7.5% | 10.9 |
| Detroit. MI | -7.8% | -3.5% | -6.4% | 26.2 |
| Dallas-Fort Worth, TX | -6.7% | -3.0% | -5.2% | 31.7 |
| Hartford, CT | -14.4% | -7.4% | -12.2% | 15.0 |
| Houston. TX | -7.9% | -4.8% | -6.6% | 20.5 |
| Indianapolis, IN | -8.1% | -2.5% | -6.2% | 39.1 |
| Jacksonville, FL | -6.8% | -3.6% | -5.6% | 35.1 |
| Kansas City, MO-KS | -5.9% | -3.4% | -4.9% | 23.7 |
| Los Angeles, CA | -16.4% | -12.4% | -14.7% | 5.7 |
| Las Vegas, NV | -10.8% | -8.1% | -9.8% | 10.8 |
| Louisville, KY-IN | -7.4% | -5.3% | -6.6% | 19.9 |
| Memphis, TN-MS-AR | -9.0% | -4.0% | -7.1% | 26.7 |
| Miami, FL | -10.5% | -8.4% | -9.6% | 9.9 |
| Milwaukee, WI | -12.6% | -6.5% | -10.6% | 10.5 |
| Minneapolis-St. Paul, MN-WI | -11.4% | -6.5% | -9.8% | 12.2 |
| Nashville, TN | -5.7% | -2.7% | -4.6% | 46.1 |
| New Orleans, LA | -10.2% | -6.9% | -8.9% | 15.9 |
| New York, NY-NJ-PA | -13.1% | -16.5% | -14.4% | 1.6 |
| Oklahoma City, OK | -6.8% | -2.5% | -5.3% | 81.3 |
| Orlando, FL | -11.1% | -3.9% | -8.7% | 11.8 |
| Pittsburgh, PA | -9.7% | -5.2% | -8.2% | 12.7 |
| Philadelphia, PA-NJ-DE-MD | -14.0% | -7.2% | -11.8% | 6.0 |
| Phoenix, AZ | -9.1% | -5.3% | -7.6% | 18.1 |
| Portland, OR-WA | -15.1% | -7.9% | -12.5% | 8.0 |
| Providence, RI-MA | -11.1% | -3.1% | -8.4% | 25.3 |
| Raleigh, NC | -7.4% | -3.1% | -5.9% | 42.8 |
| Rochester, NY | -14.7% | -3.3% | -11.0% | 19.1 |
| Riverside-San Bernardino, CA | -8.0% | -3.9% | -6.5% | 32.7 |
| Richmond, VA | -8.9% | -5.6% | -7.7% | 20.9 |
| Sacramento, CA | -10.9% | -4.8% | -8.6% | 17.0 |
| San Antonio, TX | -7.0% | -4.2% | -6.1% | 35.1 |
| San Diego, CA | -14.3% | -7.0% | -11.5% | 11.5 |
| Seattle, WA | -10.9% | -6.4% | -9.3% | 7.3 |
| San Francisco-Oakland, CA | -12.5% | -12.4% | -12.5% | 3.8 |
| San Jose, CA | -14.7% | -8.0% | -12.3% | 12.6 |
| Salt Lake City, UT | -9.6% | -5.3% | -8.1% | 16.3 |
| St. Louis, MO-IL | -8.0% | -2.8% | -6.3% | 19.6 |
| Tampa-St. Petersburg, FL | -6.6% | -2.7% | -5.1% | 31.8 |
| Virginia Beach-Norfolk, VA-NC | -8.7% | -8.9% | -8.8% | 19.8 |
| Washington, DC-VA-MD-WV | -12.0% | -7.3% | -10.4% | 4.7 |
| Total: 51 Metropolitan Areas | -9.8% | -6.0% | -8.4% | 7.9 |
| New York | -13.1% | -16.5% | -14.4% | 1.6 |
| Outside New York | -10.1% | -5.5% | -8.4% | 11.0 |
| Average of Metropolitan Areas | -10.1% | -5.5% | -8.5% | 12.7 |
| Median | -9.8% | -5.0% | -8.2% | 17.0 |
| Maximum | -5.6% | -2.1% | -4.3% | 81.3 |
| Minimum | -16.4% | -16.5% | -14.7% | 1.6 |
| Note: Median Earnings: $29,701 | ||||
| Source: American Community Survey: 2006-2010 | ||||
A Line Driven in a Car: Why is this the case? The "bottom line" has been perhaps best characterized by Marge Waller and Mark Allen Hughes in a research paper for the Progressive Policy Institute of the Democratic Leadership Council.
In most cases, the shortest distance between a poor person and a job is along a line driven in a car. Prosperity in America has always been strongly related to mobility and poor people work hard for access to opportunities. For both the rural and inner-city poor, access means being able to reach the prosperous suburbs of our booming metropolitan economies, and mobility means having the private automobile necessary for the trip. The most important response to the policy challenge of job access for those leaving welfare is the continued and expanded use of cars by low-income workers
Concerns about the automobile based urban transportation system excluding lower income citizens are misplaced. Despite all the hand-wringing, America's lower income population has considerable access to cars and far greater mobility as a result. It is no more than a figment of planner's imaginations that lower income citizens would be best served by constraining car use and trying to force them into transit service that more often than not gives circuitous, slower and often impossible for access to work opportunities.
Wendell Cox is a Visiting Professor, Conservatoire National des Arts et Metiers, Paris and the author of “War on the Dream: How Anti-Sprawl Policy Threatens the Quality of Life”
-----
Note 1: As used in this article, automobile includes cars, trucks and vans.
Note 2: This estimate estimates lower income 45 minute access using the ration between 90 minute and 45 minute for all employees (as reported in the Brookings Institution report)
Photograph: Classic early 1950s Buick, Sinsheim Auto & Technik Museum, Sinsheim, Baden-Württemberg, Germany (by author).


Seattle region after two decades of Smart Growth
Anybody seeking to interpret Wendell's and Todd's contrasting views on North American mobility should study the transit mode share experience to date, and the planning for transit on into the future, of urbanized Western Washington State, particularly the central Puget Sound region from Everett to Tacoma.
Smart Growth has been a policy in this very green region since at least 1990 when the Metropolitan Planning Organization (http://psrc.org) established the Vision 2020 plan for urban centers. With near unanimous support from elected officials, this plan tries to get more housing and jobs in these denser places, and then connect them by a high capacity transit network that has been slowly coming into place since 1996.
Vision 2020 evolving into Vision 2040 is described at http://psrc.org/assets/3074/From_VISION_2020_to_VISION_2040.pdf
Since 1990 a statewide growth management law in Washington imposes urban growth boundaries in all parts of the I-5 corridor to which homes and commerce are spreading. Financial support for transit has been strong. There is a 1.8% sales tax for transit in two of the three central counties and 1.5% in the other. All the urban areas in Western Washington have taxpayer-supported public transit. Smart growth urban housing clusters are visible here and there throughout the region. Trains are now running between urban centers, and more tracks are under construction.
In other word, the Seattle-Tacoma region has been trying hard to do what Todd suggests. But what has happened is what Wendell describes in the essay above, and in other essays for New Geography. There's a contrast between ideas for change and emerging reality on the ground.
I'll skip over the failure since 1990 up to the present day to get the transit mode share in the Seattle-Tacoma metro region above 10%, and simply note that the continuation of the MPO's work is to spend half of government transportation investment over the next three decades on public transit, about $100 billion.
Disappointingly, this much spending increases the transit all-trips mode share from the 3% baseline resulting from over two decades of Smart Growth policies to just 5% after 30 more years of Smart Growth implementation. For commuting trips to work, the transit mode share needle is forecast to move from 10% to 17%. Past forecasts of transit use have been higher than what happened as the years went by. Anybody want to call these numbers a forecast of success?
What's going on in my home region is a combination of the historical predilection toward automobile use described by Wendell, and a policy-driven attempt to cause more transit use as advocated by Todd. The result is that car use is winning over transit by multiples despite governments collecting and spending a lot of tax money for buses and trains.
The problem for transit's future around here is that even after spending $100 billion, buses and trains won't go to all the places where people want to go when they want to go there, nor how quickly they want to go there.
Based on trends I see, private automobiles will become smaller, safer, cleaner, more affordable to buy, more energy efficient, cheaper to operate, longer lasting, increasingly with automated driver assistance, and with road and parking user fees to shape demand away from peak period use. I expect cars will continue to win as the mode of choice, even for poor people who have to get by with used cars.
For more detail, I summed up Puget Sound regional high capacity transit spending and resulting mode share in two short comments delivered to the 2011 and 2010 Puget Sound Regional Council General Assembly posted at http://www.effectivetransportation.org .
Even as one who is sympathetic to the intent of walkable, livable Smart Growth, I assess what is actually happening on the ground described by Wendell as very difficult to redirect along the lines of the improvements that Todd describes, based on what my home town has achieved with a great deal of effort and spending.
Transportation Options for Lower-Income People
Thanks for your comments, John. However, you have not addressed the issue. The question Cox raises and I analyze is whether high automobile commute mode share by lower-income people is optimal and should be supported by public policy. I conclude that it reflects a lack of affordable transport and location options and imposes significant costs on many lower-income people and society overall. You are simply restating your often-voiced conclusion that Seattle's rail transit program is cost ineffective. Your analysis does not disaggregate by income class so there is no way to know whether lower-income people benefit from Seattle's effort to create more accessible, multi-modal communities. I suspect they do.
You imply that improving transport options for economically and physically disadvantaged people at a structural level (i.e., through regional transport and land use policy reform) is unimportant and too costly, and any problems associated with automobile dependency will solve themselves as "private automobiles will become smaller, safer, cleaner, more affordable to buy, more energy efficient, cheaper to operate, longer lasting, increasingly with automated driver assistance". You are welcome to your opinion, but to me it seems irresponsible because you are ignoring very real problems.
Todd Litman is founder and executive director of the Victoria Transport Policy Institute (www.vtpi.org), an independent research organization dedicated to developing innovative solutions to transport problems.
An irresponsible opinion?
Todd, in re your last "You imply ..." paragraph where you ended up calling my opinion "irresponsible" because I am "ignoring very real problems."
"Irresponsible" is a charged term not appropriate for this comment stream, especially when I didn't imply what you said I implied.
In my long comment that you are reacting to, I didn't go into my disagreements with your characterization of the problems of automobile use, although I have some. Instead, I focused in my comment on the way one urban region I know well (Seattle-Tacoma) is addressing the problems, and on the performance in mode split results that is resulting, the topic of Wendell's essay. That's all I was trying to do.
I did not intend to imply, quoting you about me, "regional transport and land use policy reform [are] unimportant and too costly." I did not mean to imply, quoting you about me, "any problems associated with automobile dependency will solve themselves."
I was only pointing out that the transit-oriented development style of solution for "automobile dependency" that I am observing in Seattle-Tacoma -- that seem to have some of the characteristics of the "innovative solutions to transport problems" that you advocate -- is ineffective in comparison to the public investment.
Finally, in focusing on Seattle, I certainly don't mean to imply that government officials here are doing all that you apparently would recommend. Indeed, as you point out in the Facebook stream of commentary about this discussion we are having here in New Geography,
"Seattle ...continues with many policies that favor automobile travel; outside a few major commercial centers most on-street parking is unpriced, developers are still required to provide generous parking supply, few roads are priced, fuel taxes have declined in real value, only a minority of streets have bike and bus lanes, and most transit services are inferior. The exception is the expensive new rail system that only started two years ago and so should not be expected to have much effect." [Todd's words on Facebook in reaction to my New Geography comment.]
Conventional Wisdom vs. Reality
This article hit home. As a developer, in a project planning meeting for a retail project that would be oriented to the lower income demographic, there was plenty of the usual discussion about Transit Oriented Development (TOD), reducing parking, minimizing vehicle traffic, etc. etc.
One of the constituents in the meeting mentioned that for all of the planners' and developers' noble goals, they don't realize that, in addition to the mobility reasons cited in Mr. Cox's article, many lower income people perceive a stigma associated with using public transportation and prefer to use cars.
Just reminded me to always check my assumptions. Conventional wisdom, especially that of "experts", is often wrong.
self-fulfilling prophecy
To put the problem more succintly: if you deprive people of non-car options, OF COURSE most of the commuting will be by car. Non-car trips simply will not happen.
Reasons To Be Concerned About Inadequate Transport Options
That lower-income U.S. households rely primarily on automobile transport can simply indicate inadequate transport options, which force people to own more vehicles and drive more than is optimal to them and society. This high degree of automobile dependency imposes significant costs, particularly on lower-income households:
* Households in automobile-dependent communities tend to devote an excessive portion of their household budgets to transportation. For example, Lipman (2006) found that among lower-income households ($20,000-35,000 annual income) in mid-western communities, the portion of household income devoted to housing was about the same regardless of location, but transport expenditures increased from just 22% for those in city center locations up to 37% for those located in more exurban locations. This is a major financial burden and exposes those households to even greater financial risks when fuel prices increases. Described differently, smart growth policies that improve transport options and increase the supply of affordable housing in multi-modal communities can provide significant consumer savings and affordability.
* Lower-income households tend to drive less reliable vehicles, which exposes them to financial and crash risks, and they tend to pay higher vehicle insurance premiums and so often drive uninsured, which exposes them to financial and legal risks. Described differently, smart growth policies can provide significant financial security and safety.
* Many lower-income families are time-stressed, in part because a lack of transport options force drivers to chauffeur family members who cannot drive. Described differently, smart growth policies can reduce household time burdens and stress.
* High rates of automobile travel increase overall crash risks. Residents of automobile dependent communities have about four times higher traffic fatality rates as residents of smart growth communities. Described differently, smart growth policies can provide significant traffic safety benefits.
* High rates of automobile travel are also associated with high rates of obesity and associated health problems such as diabetes, particularly among lower-income residents. Described differently, smart growth policies can provide significant health benefits.
Mr. Cox misrepresents the issue when he claims that subsidizing automobile use is necessarily the best way to improve lower-income workers' access to employment options. In some cases that is true, but in many situations improving alternative modes can provide the same access to economic opportunities at much lower cost, leaving those workers with more net income. See for example analysis by Gao and Johnson (2009) and Sanchez, Shen and Peng (2004).
Mr. Cox also misrepresents the issues when he claims that planners want to force workers to use "transit service that more often than not gives circuitous, slower and often impossible for access to work opportunities" or that smart growth is simply "densification." Smart growth involves various policy reforms that improve land use accessibility and transport options (more compact, mixed development; increased road and sidewalk connectivity; walking, cycling and public transport improvements; more affordable-accessible housing), which allows people to choose the transport options that best meet their needs for each trip. This benefits everybody, and is particularly important to people with lower-incomes, disabilities and other constraints on their ability to drive.
For More Information
CTOD (2009), Mixed-Income Housing Near Transit: Increasing Affordability With Location Efficiency, Center for Transit-Oriented Development and Reconnecting
America (www.reconnectingamerica.org); at www.reconnectingamerica.org/public/display_asset/091030ra201mixedhousefi....
Yingling Fan and Arthur Huang (2011), How Affordable is Transportation? An Accessibility-Based Evaluation, CTS Report 11-12, Transitway Impacts Research Program, Center for Transportation Studies (www.cts.umn.edu); at www.cts.umn.edu/Publications/ResearchReports/reportdetail.html?id=2024.
Shengyi Gao and Robert A. Johnston (2009), “Public vs. Private Mobility for Low Income Households: Transit Improvements vs. Increased Car Ownership in the Sacramento Region,” Transportation Research Record 2125 (www.trb.org), pp. 9-15.
Peter M. Haas, Carrie Makarewicz, Albert Benedict, Thomas W. Sanchez and Casey J. Dawkins (2006), Housing & Transportation Cost Trade-offs and Burdens of Working Households in 28 Metros, Center for Neighborhood Technology (www.cnt.org); at www.cnt.org/repository/H-T-Tradeoffs-for-Working-Families-n-28-Metros-FU....
Housing and Transportation Affordability Index (www.htaindex.cnt.org) calculates and compares combined housing and transportation costs for a particular U.S. location based on household expenditure data and geographic data such as a neighborhood’s development density and public transit service quality.
Barbara Lipman (2006), A Heavy Load: The Combined Housing and Transportation Burdens of Working Families, Center for Housing Policy (www.nhc.org/pdf/pub_heavy_load_10_06.pdf).
Todd Litman (2007), Transportation Affordability: Evaluation and Improvement Strategies, VTPI (www.vtpi.org); at www.vtpi.org/affordability.pdf.
Todd Litman (2010), Affordable-Accessible Housing In A Dynamic City: Why and How To Support Development of More Affordable Housing In Accessible Locations, Victoria Transport Policy Institute (www.vtpi.org); at www.vtpi.org/aff_acc_hou.pdf.
Tomas Sanchez, Q. Shen and Z. Peng (2004), “Transit Mobility, Jobs Access and Low-income Labour Participation in US Metropolitan Areas,” Urban Studies, Vol. 41, No. 7, pp. 1313-1331.
ULI (2009), Bay Area Burden: Examining the Impacts and Hidden Costs of Housing and Transportation on Bay Area Residents, Their Neighborhoods, and the Environment, ULI Terwilliger Center for Workforce Housing (www.uli.org); at http://bayareaburden.org/wp-content/uploads/2009/11/Bay-Area-Burden_FINA.... Also provides a Cost Calculator which estimates the typical costs of housing and transportation for various locations within the San Francisco Bay Area.
Asha Weinstein Agrawal, et al. (2011), Getting Around When You’re Just Getting By: The Travel Behavior and Transportation Expenditures of Low-Income Adults, Report 10-02, Mineta Transportation Institute (www.transweb.sjsu.edu); at www.transweb.sjsu.edu/MTIportal/research/publications/documents/2806_10-....
=========================================
Todd Litman is founder and executive director of the Victoria Transport Policy Institute (www.vtpi.org), an independent research organization dedicated to developing innovative solutions to transport problems.
Litman's assessment is
Litman's assessment is dead-on.
Low to moderate income families do not drive by choice, as many would prefer to use their scarce resources on other things - like food and utility payments. There is a spacial mismatch between where people live and where they work. Employment opportunities available to low income families and individuals have migrated farther and farther from the places where low income individuals and families have over time become increasingly concentrated, and isolated from opportunity.
Cox's observation that jobs are not accessible by transit underscores a problem that is not being effectively addressed through our transportation policies and investment strategies, which are marred down in an obsolete understanding of the value of highway investments in continuing to promote personal mobility and regional accessibility. Our road networks are built-out. Incremental gains in road capacity are not adequate - nor an advisable strategy - in addressing capacity constraints, let alone the unique needs of low to moderate income families.
What is abundantly clear, even from Cox's strained analysis, is that people can't get to where they want or need to go by way of affordable, reliable, and efficient transit service. This lack of transit accessibility impacts the lives of all socio-economic subsets of American society while at the same time escalating the many and varied costs of urban congestion.
The issue is not more access to cars, or building new road capacity that we know to be insufficient to achieve the highway engineer's golden ring - free-flow traffic - it is, quite simply, a pressing need to make transit a viable option for all.
Mr. Cox's argument is based on an understanding of the world that dominated during the period the vintage car portrayed in his piece was manufactured. We need 21st century thinking to effectively address our nation's pressing concerns; the ruins of Detroit foreshadow broader implications for America if we don't.
I think vehicles are the
I think vehicles are the common and easiest way of communication and it is also cost effective rather than air way or water path communication. After reading this article I think I am right.With this i got a brief idea about communication, types of vehicle and its cost. Thanks for giving us these valuable information.
Auto News