The 2020 TomTom Traffic Index reflects a huge drop in worldwide urban traffic congestion levels. Congestion levels (rated by the percentage of additional time required for auto travel during “rush hour”) dropped in 387 urban areas while increasing in only 13. Overall, TomTom rates 416 urban areas in 57 international geographies. The TomTom Traffic Index is produced by TomTom International BV. TomTom is known for its satellite navigation services for drivers and maps.
According to TomTom, “The COVID-19 pandemic has dramatically changed the way we live, work and move. Lockdowns, remote working and other restrictions on movement have transformed patterns of movement and reduced traffic congestion in most cities.” Similar results were just reported for many more US urban areas in Record Low Congestion Levels in Seattle, LA & San Francisco: The 2020 Urban Mobility Report, with congestion down by about 50% and greenhouse gas emissions from commuting also down 50%.
TomTom reports that: “This year we witnessed a mass exodus of people from capital cities across Europe. The day before new lockdowns went into force was the most congested day in Athens and London in 2020. Meanwhile in Paris, traffic jams reached record lengths,” where a congestion level of 142% was recorded. This an incredibly high traffic congestion index --- 2.6 times the highest annual congestion level recorded in the most congested urban area (Moscow, at 54%, below) and 4.4 times the Paris 2020 congestion level (Paris had the 42nd highest congestion index out of the 416 urban areas).
Congestion Levels by Nation
The TomTom Traffic Index provides congestion levels for 10 or more urban areas in eight nations (including the European Union).
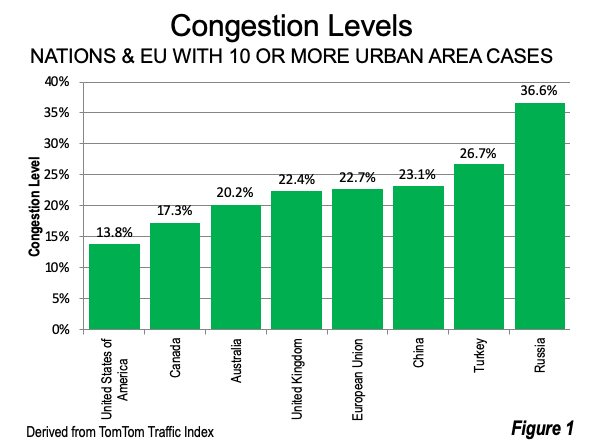
The United States has the lowest congestion level, at an average of 13.8% (Figure 1). This is not surprising, given the comparatively low densities of US urban areas (Demographia World Urban Areas, Schedule 1, Page 19) and the unparalleled dispersion of employment and the fairly comprehensive limited access expressway system. Canada ranks second, at 17.3%, despite having urban population densities double that of the US, and more limited expressways. Australia has the third best congestion level at 20.2%. The United Kingdom, the European Union and China are bunched from fourth to sixth, within 0.7% of one another. Turkey’s congestion level is at 26.7% while Russia has by far the highest congestion level, at 36.6%.
Congestion Levels by Urban Area Population
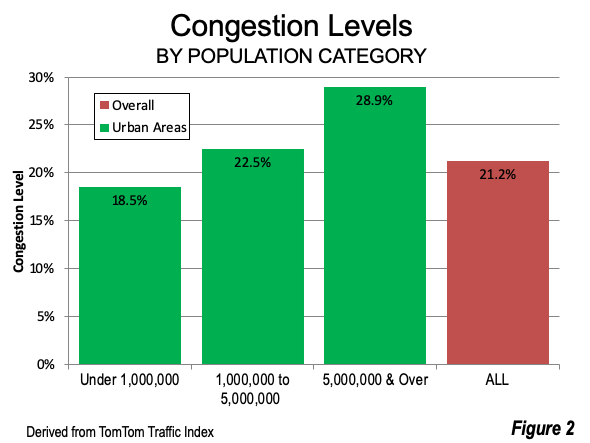
As would be expected, the worst congestion levels are in the largest urban areas (over 5,000,000), at 28.9% (Figure 2). The 1,000,000 to 5,000,000 category has a congestion level of 22.5%, The smallest category (under 1,000,000) has a congestion level of 18.5%. Overall, the average congestion level is 21.2% (urban area population categories are based on data from Demographia World Urban Areas).
The highest and lowest congestion levels are reviewed below, by population category.
Urban Areas Over 5,000,000 Population
Because of ties (urban areas with the same congestion level), 13 urban areas have top ten congestion levels in the largest population category (5,000,000+ population), seven of which are in the United States and four are in China.
The lowest congestion levels were in Dallas-Fort Worth (USA) and Dongguan, China, both at 13% (Figure 3). Dallas-Fort Worth had the lowest congestion level in this population category at least twice before (2017 and 2015). Dongguan is a Pearl River Delta urban area of about 8 million residents, located between two much larger urban areas, Guangzhou-Foshan and Shenzhen.
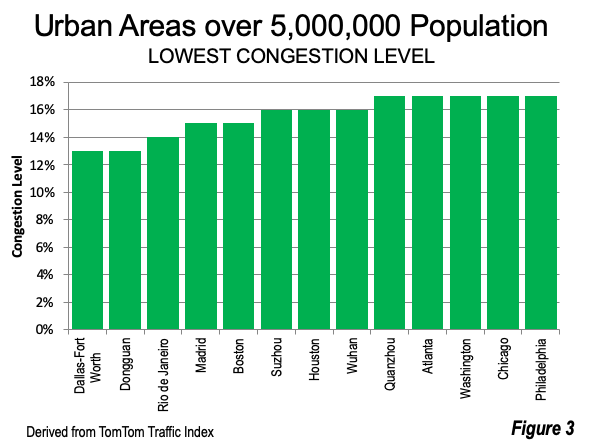
Rio de Janeiro had the third least congestion, while Madrid and Boston tied for the fourth position. There was a three way tie for 6th place between Suzhou (Jiangsu, China), Houston and Wuhan. Quanzhou (Fuzhou, China), Atlanta, Washington, Chicago and Philadelphia made a five way tie for 10th best congestion level. Quanzhou may be China’s most decentralized urban area, with its “in situ” urbanization (urbanization in place, rather than by expansion from a core) that involves conversion of rural areas in place to urban areas, with agricultural employment being replaced by non-agricultural employment).
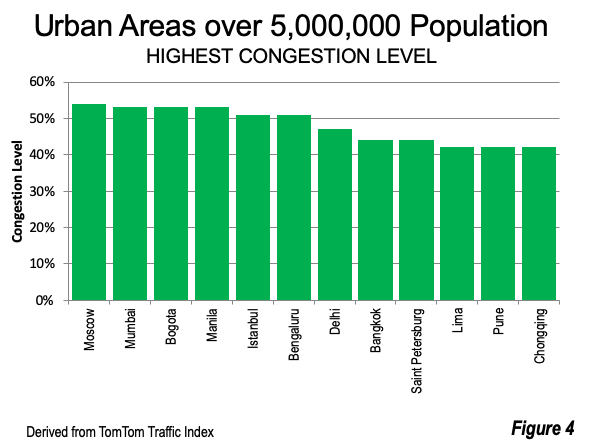
The highest congestion levels in the 5,000,000+ population category included six of the highest density urban areas in the world: Bogota, Manila, Bangalore, Delhi, Lima and Pune (all with more than 25,000 per square mile or 10,000 per square kilometer). By comparison, the average world urban area with more than 500,000 population is 10,800 per square mile or 4,200 per square kilometer.
The highest congestion level was in Moscow, at 54% (Figure 4). The next three, Mumbai, Bogota and Manila were in a three way tie for third worst congestion. Each of these three urban areas is very high density, at over 30,000 per square mile (over 12,000 per square kilometer). Istanbul and Bengaluru (Bangalore), India shared the 6th highest congestion levels. Delhi, the world’s third largest urban area had the seventh highest congestion level. Bangkok and St. Petersburg shared 8th position. There was a three way tie for 9th, which included Lima, Pune (India) and Chongqing (China).
Urban Areas 1,000,000 to 5,000,000 Population
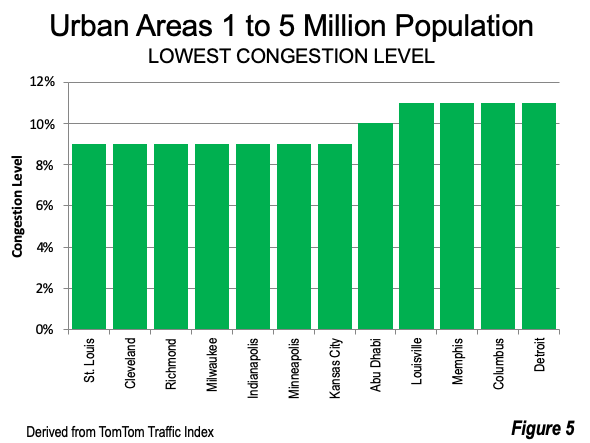
There are 12 urban areas with top ten congestion levels in the 1,000,000 to 5,000,000 population category), 11 of which are in the United States and Abu Dhabi in the United Arab Emirates.
There was a seven way tie between US urban areas for the lowest traffic congestion level (9%) — St. Louis, Cleveland, Richmond, Milwaukee, Indianapolis, Minneapolis-St. Paul and Kansas City. Abu Dhabi (United Arab Emirates) took 8th place. There was a four way tie at 9th place between Louisville, Memphis, Columbus and Detroit (Figure 5).
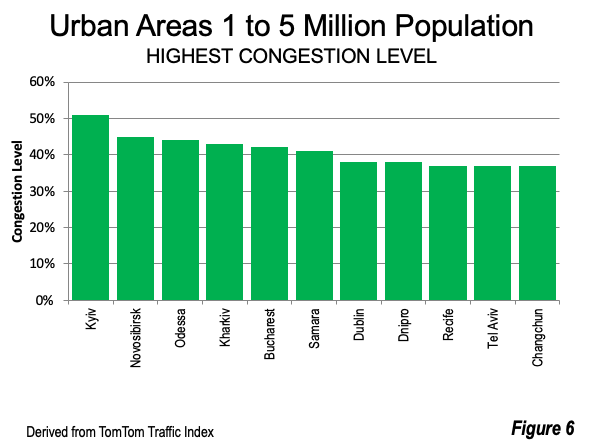
There are 11 urban areas with the highest congestion levels in the 1,000,000 to 5,000,000 population category. Four are in Ukraine and two are in Russia.
The worst congestion was in Ukraine’s capital Kyiv, at 51%, a higher congestion level than all but six other urban areas of any size (Figure 6), despite a population of less than 3,000,000. Number two Novosibersk (Russia) has an even smaller population, below 2,000,000, but has a congestion level that ranks 9th highest out of the 416 urban areas. Ukraine’s Odessa and Kharkiv rank third and fourth, while Bucharest (Romania) ranks fifth, just ahead of Samara, Russia. Dublin and Dnipro (Ukraine) tied for seventh, followed by a three-way tie for 9th, consisting of Recife (Brazil), Tel Aviv and Changchun (Jilin, China).
Urban Areas Under 1,000,000 Population
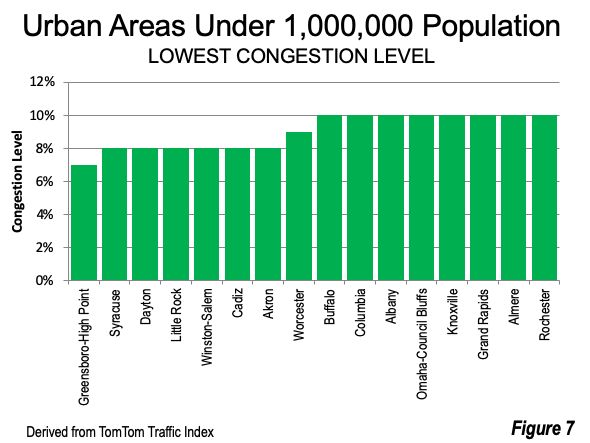
There are 14 urban areas with top ten congestion levels in the under 1,000,000 population category, 12 of which are in the United States, along with Cadiz, Spain and Amere in the Netherlands.
Greensboro-High Point (US) had the lowest congestion level, at 7%. A six way tie for second place included Cadiz, Dayton, Little Rock, Akron, Syracuse and Winston-Salem. Worcester (MA) took 8thplace. There was an 8 way tie for 9th place including Buffalo, Albany, Columbia (SC), Omaha, Knoxville, Grand Rapids and Rochester, and Amere (Figure 7).
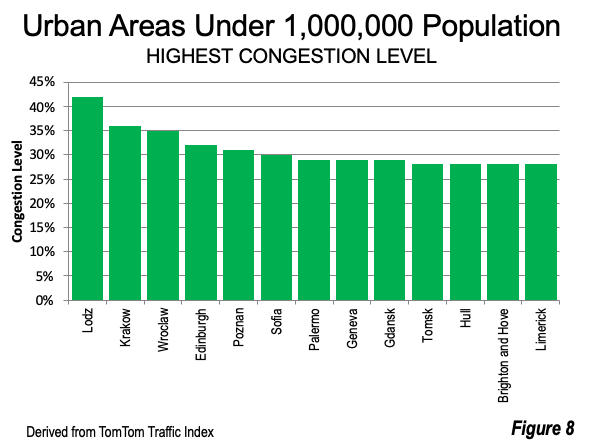
Among the 13 urban areas with the highest congestion levels in the under 1,000,000 category, five are in Poland. All of the others are in European nations.
The highest congestion level was in Lodz, Poland, at 42%, which was followed by two other Polish urban areas, Krakow and Wroclaw. Edinburgh was fourth, followed by another Polish urban area, Poznan. Sofia, Bulgaria had the sixth worst congestion level, while Palermo (Italy), Gdansk (Poland) and Geneva shared 7th place. Tomsk (Russia), Brighton and Hove, and Hull (United Kingdom) and Limerick (Ireland) were in a four way tie for 9th place (Figure 8).
Changing Traffic Forever?
As has been evident in international traffic congestion indexes before, the United States has dominated low congestion levels. Thirty of the 39 urban areas with top 10 congestion levels were in the United States. China had six of the top 39 urban areas with the lowest congestion levels.
TomTom suggests that “COVID-19 could change traffic forever” and imagines a future more based on remote work, in which “We'll no longer waste hours stuck in traffic as working from home will became the norm for most jobs. Rush hour traffic will all but disappear, making journeys faster and less stressful.” This more environmentally friendly future, with its more enriching lives could well be achievable.
Wendell Cox is principal of Demographia, an international public policy firm located in the St. Louis metropolitan area. He is a founding senior fellow at the Urban Reform Institute, Houston, a Senior Fellow with the Frontier Centre for Public Policy in Winnipeg and a member of the Advisory Board of the Center for Demographics and Policy at Chapman University in Orange, California. He has served as a visiting professor at the Conservatoire National des Arts et Metiers in Paris. His principal interests are economics, poverty alleviation, demographics, urban policy and transport. He is co-author of the annual Demographia International Housing Affordability Survey and author of Demographia World Urban Areas.
Mayor Tom Bradley appointed him to three terms on the Los Angeles County Transportation Commission (1977-1985) and Speaker of the House Newt Gingrich appointed him to the Amtrak Reform Council, to complete the unexpired term of New Jersey Governor Christine Todd Whitman (1999-2002). He is author of War on the Dream: How Anti-Sprawl Policy Threatens the Quality of Life and Toward More Prosperous Cities: A Framing Essay on Urban Areas, Transport, Planning and the Dimensions of Sustainability.
Photograph: Downtown Dallas, Dallas-Fort Worth urban area: Tied with Dongguan (China) for lowest congestion level in 2020 TomTom Traffic Index (by author).


Washington (DC-VA-MD) Tom Tom Congestion Level in 2019
Thank you for the question.
In 2019 (pre-pandemic year) Tom Tom found a 29% congestion level for the Washington urban area. This is marginally above the median of 25% and ranks WDC at 142nd worst out of 416. Washington's congestion level was better, for example, than New York, Seattle and San Francisco but worse than Atlanta, Boston and Chicago.
Wendell Cox
Demographia
www.demographia.com
Good to be reminded
That U.S. congestion levels pale before those elsewhere in the world. But it would be surprising if Washington DC beltway was a low-congestion metro under normal circumstances.