As with other advanced capitalist societies, the US population is aging. About 30 percent of US counties experienced natural decrease – more deaths than births – in the 2000-2007 period.
Nevertheless, the most exceptional feature of the United States remains its unusually high level of natural increase, and significant degree of population growth. This is often attributed to the high level of immigration, especially from Mexico, illegal as well as legal, and their high fertility. This process is indeed critical, even though most of the migration is in fact legal, and the share from Mexico is not as high as commonly perceived. Also most of the Hispanic population in the United States is native, not immigrant.
Perhaps a more important feature of US society contributing to a smaller decline in fertility than in most other advanced countries is the extraordinary cultural traditionalism of perhaps half the American population. This is reflected in the so-called “culture wars”: a more educated modernism, pejoratively dubbed as “secular humanist,” versus a more traditional, religion-observing “moral majority.”
Conservatives campaign against abortion and even contraception, and maintain an amazingly high level of religiosity and skepticism of science, creating a climate favorable to a level of fertility above replacement levels (2.1 per female). The super pro-child Mormon Church alone claims millions of members, and evangelical groups boast even more. This creates a fascinating, future-influencing tension between a younger-growing, more educated population choosing lower fertility on average, and a more traditional population more successful at reproducing themselves!
Natural increase, then, can be expected in the following kinds of areas. One is heavily Hispanic areas. Those with more recent immigrant stock have higher fertility, but above replacement fertility seems to persist for several generations. Another lies in Native American Indian areas. The explanation here is controversial, but there is perhaps a sense of the need for more children as a reaction to a perceived threat of loss of identity.
For areas with more vibrant economic growth, attracting and maintaining young workers constitute another focal point for natural increase. These are overwhelmingly urban, even metropolitan. Note that these areas may not have above replacement fertility, but will have natural increase, simply because of the younger age structure of the population.
Other strong candidates for natural increase include military base areas, because of the prevalence of young families. Likewise Mormon areas, and fundamentalist religion areas, at least where there remain sufficiently young populations.
Seventy percent of counties had natural increase, differing from counties with natural decrease by higher immigration, much higher levels of urban population, a much younger population, and far higher levels of racial and ethnic minorities, especially Hispanics.
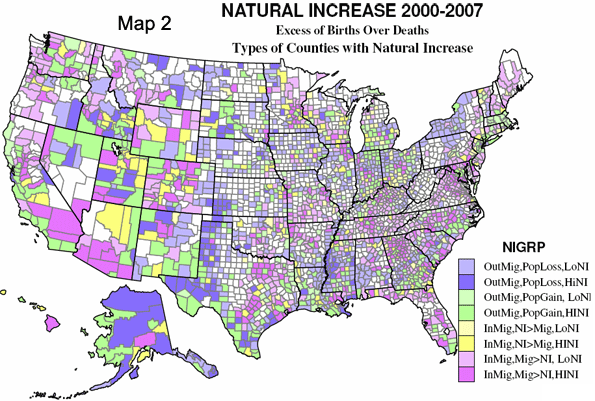
A little more than half (1193) of counties with natural increase had net domestic out-migration – more people leaving than moving into the county, and of these the majority (702) lost population, while in the other 492 natural increase was greater than the out-migration loss, resulting in population gains. Out migration counties differ from in-migration counties ONLY because of the markedly higher ethnic and racial minority shares, obviously reflecting much weaker economic performances. The population losing counties had especially high African American population shares and were more rural.
The net in-migration counties (1093) are usefully separated into those in which natural increase exceeded the net in-migration (only 272 counties) and those in which net in-migration was dominant (821). The former had slightly higher minority shares, and were somewhat more urban.
Geography of Natural Increase
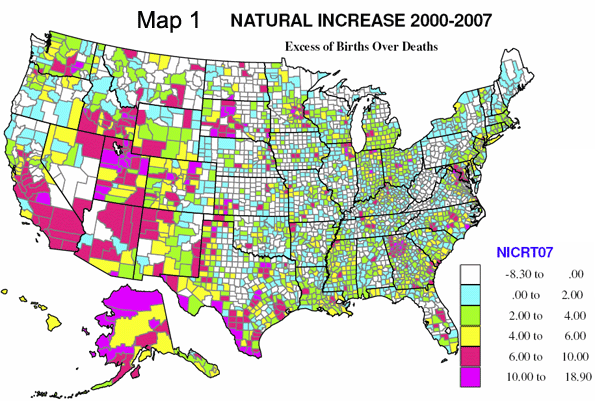
Figure 1 maps natural increase by five levels, with cooler colors having a small natural increase (here in the simple sense of the excess of births over deaths as a share of the base population), and warm colors indicated high levels of natural increase. Rates of over 10 percent are really startlingly high.

Natural increase prevails over much of the country, with the exception of much of the Great Plains, from Texas to Canada, and northern Appalachia. High levels of natural increase, over 6 percent (orange and magenta on Map 1) occur in five kinds of areas that are really highly predictable.
- First, areas of high Hispanic population, mainly from Texas to southern and central California, but also in parts of eastern Washington and southwestern Kansas.
- Second, Native American Indian reservation areas, most obviously in Alaska, New Mexico, South Dakota, Arizona but also Montana and North Dakota.
- Third, the Mormon “culture belt,” spreading from the “Zion” of Utah to Idaho, Nevada and Wyoming.
- Fourth, rapidly growing suburban and exurban counties, most notably around Houston, Dallas, San Antonio, Austin, Atlanta, Washington DC, Chicago, Minneapolis, Charlotte and Denver, and
- fifth, in counties with military bases, for example, in North Carolina, Georgia, Kansas, Oklahoma and several other states.
Above average natural increase, from 4 to 6 percent, is typical of many modestly growing metropolitan areas, both central and suburban and exurban counties, and in a scattering of rural-small town counties, especially in the west (western Colorado is notable). Low natural increase, under 2 percent, is very widespread across both urban and rural areas, and is often indicative of slow-growing economies with out-migration (please see Map 2), and in areas moderately attractive to older migrants, thus depressing births, but not enough to cause natural decrease.

Map 2 sorts counties according to in or out migration, population gain or loss, and the role of natural increase versus net in-migration. Four basic types are mapped, but then divided into high or low natural increase. Rapidly growing counties with net in-migration even greater than high natural increase (dark pink) are especially typical of suburban and exurban counties of large metropolises, and of fast-growing smaller metropolitan areas. Lower natural increase is more common for rural and small town amenity areas, as well as far exurban counties. Natural increase greater than in-migration (yellow) is not very common, and tends to occur in rural-small town counties, including several counties with high Mormon shares. Counties with out-migration but enough natural increase to permit overall population growth (green) are common in three kinds of areas. First are large central metropolitan counties – such as those containing Los Angeles, Houston, Dallas, and Miami – with high non-Hispanic white out-migration, but high Hispanic in-migration. The second type are border region counties with high Mexican in-migration, and the third are Native American Indian areas. Those counties experiencing population loss (purple) are much more like counties with natural decrease: dominantly rural or declining rust belt metropolitan areas.
Finally, what areas have the highest rates of natural increase? These see increases of 16 to 19 percent from the base population. They are Wade-Hampton, Alaska (west of Bethel); Webb, Texas (Laredo); Utah (Provo); Hidalgo, Texas (McAllen); Loudoun, Virginia (Leesburg, northwest of Washington DC); Starr, Texas (Rio Grande City); and Madison, Idaho (Rexburg). Three are Hispanic, two Mormon, one Alaska native, and one fast growing suburban.
Natural increase has remained higher than forecast 40 years ago due to far higher immigration, above replacement fertility even among the affluent and educated, and high teenage pregnancy in connection with constraints on abortion – i.e., America’s very high religious traditionalism. The unknowns ahead include the rate of future immigration, whether 2nd and 3rd generation Hispanics will reduce fertility markedly and whether education and modernism will reduce the power of tradition.
See Richard's similar piece on natural decreases in US population.
Richard Morrill is Professor Emeritus of Geography and Environmental Studies, University of Washington. His research interests include: political geography (voting behavior, redistricting, local governance), population/demography/settlement/migration, urban geography and planning, urban transportation (i.e., old fashioned generalist)


moment glucogen
propolis momentDiscovering this web site made all of the work I did to find it seem like nothing. The reason is that that is such an informative post. I needed to thanks for this particular learn of the subject. I ate each bit of it and I've you bookmarked to take a look at new stuff you post.teragen moment
good realy
thanks for this post
دانلود بازی جدید اندروید - دانلود کلیپ موبایل - دانلود تم جدید اندروید - دانلود لانچر جدید اندروید - دانلود نرم افزار اندروید - سایت دانلود موبایل
It was wondering if I could
It was wondering if I could use this write-up on my other website, I will link it back to your website though.Great Thanks.
try it
cheers for the actual
cheers for the actual article i have recently been on the lookout with regard to this kind of advice on the net for sum time right now so many thanks
natural whey protein
Download New Music
Thank you for your good content on your site. I wish you success
دانلود آهنگ جديد
tnx a lot
Thank you for your good content on your site. I wish you success
دانلود فیلتر شکن
Natural Increase
Every country has their own way to solve the politic problems. Super power country sometimes choose war to solve the problem. I hope the new politic party's government is a peace lover and not see war as a way to solve the politic problems.
دانلود آهنگ جدید
دانلود فیلم و سریال
دانلود آهنگ جدید
دانلود آهنگ جدید
بک لینک
دانلود فیلم
دانلود آهنگ جدید
Natural Increase
very very Gooood seorooz tnx Dear
دانلود آهنگ جديد
انجام پايان نامه
Cake you need to take. If
Cake you need to take. If you have experience of the area it helps you to find your way. But if you really want to understand the details of a journey and help others to www.bestessays.net it, you have to accept that some things you won’t know without measuring them.
I really loved reading your
I really loved reading your blog. It was very well authored and easy to understand. Unlike other blogs I have read which are really not that good.Thanks alot!
compare electricity prices