
Transit best serves commuting destinations that have high concentrations of employment. For the most part, this means downtowns, or central business districts (CBDs). This is where transit lives up to its “mass transit" name, carrying many people concurrently and efficiently to concentrated destinations. When the same people return home, the “mass” is at the origin, and destinations are dispersed throughout the metropolitan area outside of downtowns, much of transit service is anything but mass, as residents of suburban and other communities frequently note “all the empty buses.”
According to the City Sector Model, high density downtowns have an average of more than 23,000 jobs per square mile, 30 times the major metropolitan area average. CBD densities rise above 100,000 per square mile in New York and Chicago.
This article analyzes transit commuting destinations in the 53 major metropolitan areas (1,000,000 or more residents in 2014). The data is all taken from the 2006-2010, which has been developed by the ASHTO Census Transportation Planning Package from the ACS data and is the latest available for detailed employment locations. We used this data to develop Demographia United States Central Business Districts, which is described in this previous post.
Summary of Transit Commuting
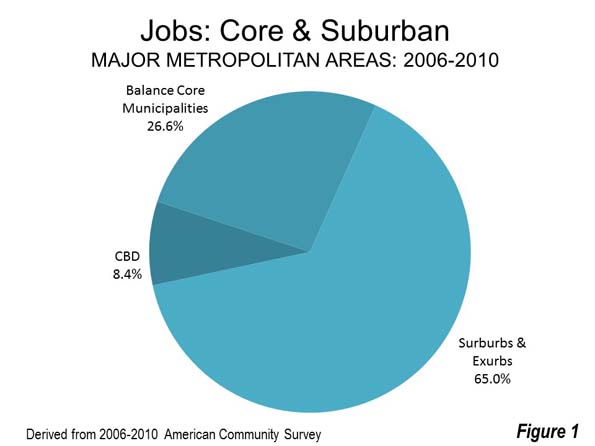
CBD’s typically have the most important concentration of tall buildings in metropolitan areas, and typically the tallest buildings. The strongest CBDs were established before the automobile became dominant, and mechanized transport, in the form of transit, was radially oriented toward downtown. To this day, many people, including some in the press and urban planning perceive downtown to be where most of the jobs are. Yet, the high density CBD’s (over 20,000 jobs per square mile) account for only eight percent of the employment in the 53 major metropolitan areas, and far less in many.
As an example, the Chicago CBD, including the Chicago Loop (photo at the top of the article) includes some of the tallest buildings in the United States and 500,000 jobs, yet accounts for only 11 percent of the metropolitan area employment. These jobs are concentrated in an area of only 3.4 square miles (8.8 square kilometers). By contrast, the built up urban area is 2,700 square miles (7,000 square miles) and the metropolitan area covers 7,200 square miles (18,500 square kilometers). This concentration of so many jobs in such a small area contributes to some the nation’s worst traffic congestion, even with a high transit market share.
The suburbs and exurbs dominate metropolitan employment, containing 65 percent of the jobs in the major metropolitan areas. The balance of the jobs (27 percent) are in the historical core municipalities, but outside the CBD (Figure 1)
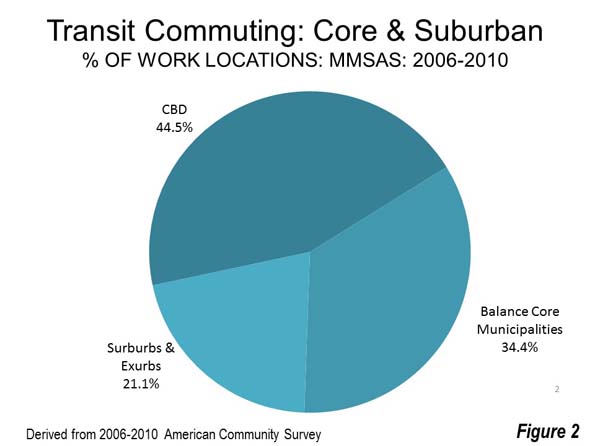
These highest CBD densities can attract very high levels of transit usage. Despite their small share of metropolitan employment, the CBDs dominate transit commuting. Approximately 45 percent of transit commuters work in the CBDs. Another 34 percent work in the balance of the core municipalities. Finally, only 21 percent were in the suburbs and exurbs, where the 65 percent employment market share is more than triple (Figure 2).
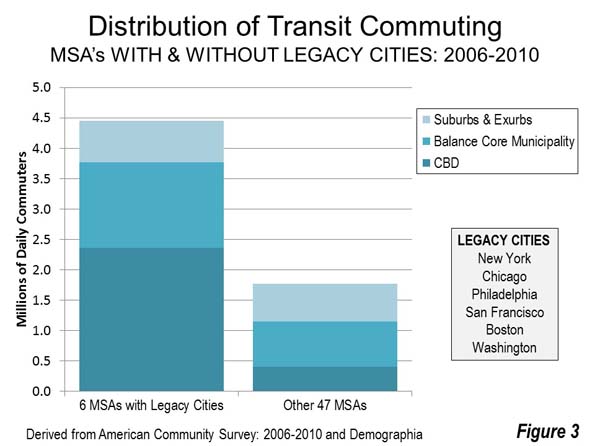
Six transit legacy cities (historical core municipalities, including New York, Chicago, Philadelphia, San Francisco, Boston and Washington) within metropolitan areas dominate transit commuting, accounting for 72 percent of work trip destinations in the major metropolitan areas and 55 percent in the nation as a whole. These municipalities are also home to the six largest CBDs. New York dominates the legacy cities, with 60 percent of the transit commuting. This is to be expected, since New York is far more dense and has by far the largest CBD.
By contrast the six legacy cities have only about 10 percent of the jobs in the major metropolitan areas, and only six percent of the jobs in the nation. Indeed, downtown commuting in the legacy cities exceeds all commuting in the 47 other metropolitan areas (Figure 3). This is despite the fact that the population of the 47 other metropolitan areas is nearly 2.5 times of the metropolitan areas with legacy cities.
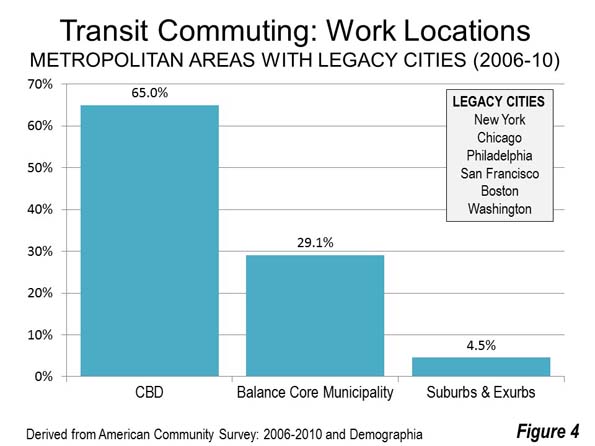
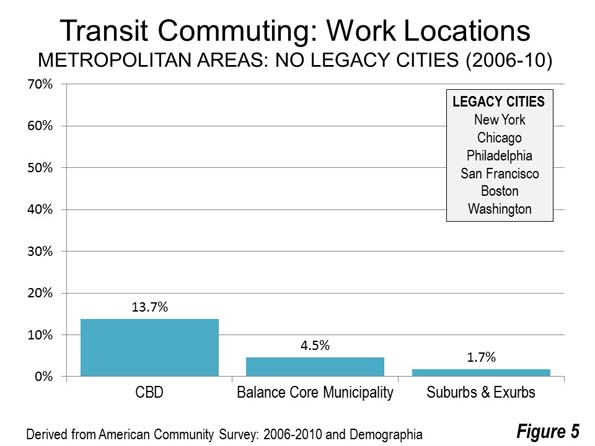
Transit commuting is heavily skewed toward CBDs in the metropolitan areas with legacy cities, and are also the highest in other metropolitan areas. However, transit market shares to work locations in the suburbs are small, even in legacy cities (Figures 4 and 5).
Central Business District
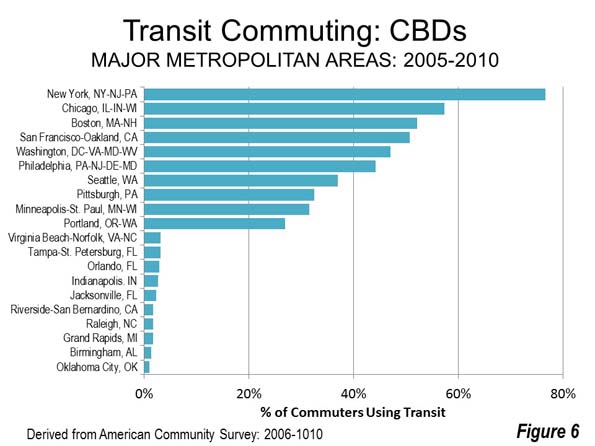
Overall 41.4 percent of major metropolitan CBD commuters accessed work by transit.
In the legacy cities, 64 percent of work access is by transit and 13 percent in the other 47 metropolitan areas.
The nation’s six largest CBDs, not surprisingly, had the largest transit market shares. In New York, south of 59th Street, transit’s market share is approximately 77 percent. In Chicago, transit share to the CBD is 57 percent, in Boston 52 percent, in San Francisco 51 percent and between 40 percent and 50 percent in Philadelphia and Washington. Seattle, Pittsburgh and Minneapolis-St. Paul followed at between 30 percent and 40 percent. Portland ranked 10th at 27 percent.
At the other end of the scale, the numbers are very modest. The bottom 10 in CBD market share all have three percent or fewer of their commuters using transit. The lowest figures are in Oklahoma City, at 0.9 percent, and Birmingham, at 1.3 percent (Figure 6).
Outside the CBD in the Core Municipalities
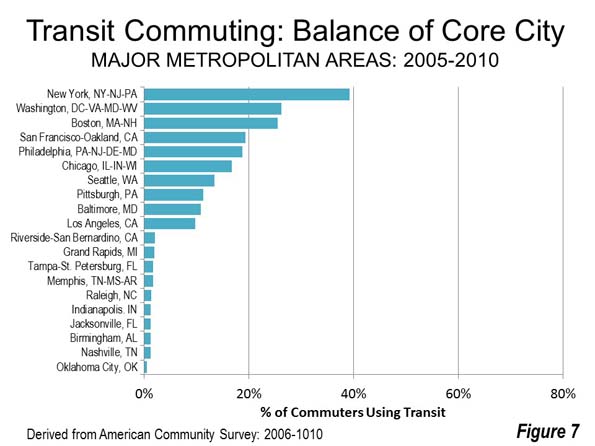
In the core municipalities and outside the CBDs, the overall transit market share was 10.5 percent. This was a much higher 29.5 percent in the metropolitan areas with legacy cities and a very small 4.5 percent in the other 47 metropolitan areas.
Some legacy cities have relatively high transit market shares outside the CBDs. As in its CBD transit market share, New York stands well above the others, at 39 percent. New York is joined by the other five legacy city metropolitan areas, with Washington and Boston having 25 to 30 percent transit market shares in the core municipalities outside the CBDs.
The bottom 10 in the core municipality outside the CBD category all have two percent or smaller transit shares. Again, Oklahoma City ranks last, at 0.6 percent (Figure 7).
In addition, there are secondary central business districts with large transit market shares in some metropolitan areas. In New York, Brooklyn, which had a transit work trip market share of 60 percent, higher than second ranking Chicago and second only to New York’s principal central business district in Manhattan. Another New York secondary central business district, the Jersey City Waterfront, across the Hudson River from Lower Manhattan, has a 51 percent transit commuting share, while 26 percent of downtown Newark’s commuters used transit. In Washington, Rosslyn attracts 23 percent of its commuters by transit.
Suburbs and Exurbs
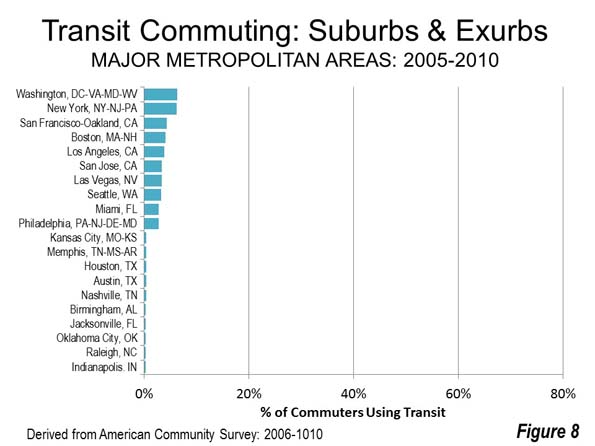
Perhaps the most surprising finding is the very low transit work location market shares in the suburbs and exurbs (the metropolitan area outside the core municipalities), even in the metropolitan areas with legacy cities. Only 4.5 percent of commuters used transit even in the metropolitan areas with legacy cities. In the other 47 metropolitan areas, the figure was 1.7 percent. Overall the suburban and exurban transit work at market share was 2.5 percent. Employment in the suburbs of even the legacy city metropolitan areas is more similar to the post-World War II automobile urban form than the core cities in the same metropolitan areas.
The highest suburban and exurban transit market shares were in Washington, at 6.3 percent and New York, in a near statistical tie. Legacy city metropolitan areas San Francisco and Philadelphia ranked third and 10th. Legacy city metropolitan area Chicago did not make the top 10.
The 10 lowest suburban and exurban market shares were all 0.4 percent or less. Four metropolitan areas congregated at the bottom at near three percent, including Jacksonville, Oklahoma City, Raleigh and last-place Indianapolis (Figure 8).
The table below contains market share for each of the 53 metropolitan areas, including CBDs, the balance of core municipalities, the suburbs and exurbs and totals.
Transit is About Downtown and the Core
The concentration of transit commuting destinations in the legacy cities and in the historical core municipalities that surround them illustrates where transit can play a significant role in mobility and access. At the same time, the small transit share elsewhere shows transit’s very limited potential (both in metropolitan areas outside the legacy cities and the 47 other metropolitan areas). This reality is confirmed by the losses and small gains in transit market share from the nation’s newer rail transit systems, which have largely been constructed outside the legacy cities. Transit is fundamentally about downtown and the core.
| Transit Work Trip Market Share by Work Location | ||||
| 2006-2010 | ||||
| Metropolitan Area | CBD | Balance: Core Municipality | Suburbs & Exurbs | Total |
| Atlanta, GA | 14.18% | 7.35% | 1.76% | 3.31% |
| Austin, TX | 5.12% | 3.42% | 0.41% | 2.56% |
| Baltimore, MD | 17.72% | 10.79% | 2.34% | 5.26% |
| Birmingham, AL | 1.32% | 1.26% | 0.35% | 0.69% |
| Boston, MA-NH | 52.18% | 25.52% | 4.13% | 11.66% |
| Buffalo, NY | 11.52% | 7.13% | 1.74% | 3.60% |
| Charlotte, NC-SC | 8.77% | 2.22% | 0.47% | 1.93% |
| Chicago, IL-IN-WI | 57.40% | 16.76% | 2.13% | 11.32% |
| Cincinnati, OH-KY-IN | 13.25% | 4.76% | 0.95% | 2.43% |
| Cleveland, OH | 15.09% | 6.20% | 1.74% | 3.70% |
| Columbus, OH | 4.89% | 2.15% | 0.55% | 1.59% |
| Dallas-Fort Worth, TX | 14.04% | 3.00% | 0.66% | 1.54% |
| Denver, CO | 19.79% | 5.22% | 2.19% | 4.68% |
| Detroit, MI | 7.48% | 4.79% | 0.74% | 1.45% |
| Grand Rapids, MI | 1.72% | 1.95% | 0.67% | 1.06% |
| Hartford, CT | 8.13% | 5.71% | 1.61% | 2.57% |
| Houston, TX | 13.15% | 3.00% | 0.41% | 2.56% |
| Indianapolis. IN | 2.64% | 1.29% | 0.26% | 1.00% |
| Jacksonville, FL | 2.33% | 1.27% | 0.30% | 1.09% |
| Kansas City, MO-KS | 7.00% | 2.45% | 0.44% | 1.23% |
| Las Vegas, NV | 5.61% | 3.78% | 3.37% | 3.56% |
| Los Angeles, CA | 22.48% | 9.74% | 3.85% | 6.01% |
| Louisville, KY-IN | 6.47% | 2.71% | 0.78% | 2.19% |
| Memphis, TN-MS-AR | 3.52% | 1.69% | 0.43% | 1.32% |
| Miami, FL | 9.35% | 7.37% | 2.82% | 3.59% |
| Milwaukee,WI | 11.05% | 5.97% | 1.43% | 3.43% |
| Minneapolis-St. Paul, MN-WI | 31.54% | 7.75% | 1.35% | 4.52% |
| Nashville, TN | 3.58% | 1.20% | 0.36% | 0.95% |
| New Orleans. LA | 6.69% | 4.93% | 0.81% | 2.44% |
| New York, NY-NJ-PA | 76.60% | 39.22% | 6.25% | 30.40% |
| Oklahoma City, OK | 0.95% | 0.57% | 0.30% | 0.48% |
| Orlando, FL | 2.91% | 3.06% | 1.10% | 1.65% |
| Philadelphia, PA-NJ-DE-MD | 44.18% | 18.72% | 2.76% | 9.14% |
| Phoenix, AZ | 11.82% | 2.95% | 1.37% | 2.19% |
| Pittsburgh, PA | 32.52% | 11.33% | 1.37% | 5.75% |
| Portland, OR-WA | 26.96% | 7.95% | 2.38% | 6.12% |
| Providence, RI-MA | 10.47% | 4.00% | 1.04% | 1.74% |
| Raleigh, NC | 1.75% | 1.42% | 0.27% | 0.88% |
| Richmond, VA | 4.93% | 4.26% | 0.80% | 1.77% |
| Riverside-San Bernardino, CA | 1.75% | 2.04% | 1.14% | 1.19% |
| Rochester, NY | 6.55% | 2.04% | 1.22% | 2.00% |
| Sacramento, CA | 12.97% | 2.87% | 1.34% | 2.66% |
| St. Louis,, MO-IL | 11.24% | 6.51% | 1.32% | 2.53% |
| Salt Lake City, UT | 12.18% | 5.26% | 1.67% | 3.64% |
| San Antonio, TX | 6.44% | 2.49% | 0.66% | 2.27% |
| San Diego, CA | 10.22% | 3.44% | 2.16% | 3.19% |
| San Francisco-Oakland, CA | 50.68% | 19.32% | 4.35% | 14.22% |
| San Jose, CA | 8.39% | 2.88% | 3.38% | 3.36% |
| Seattle, WA | 36.99% | 13.46% | 3.22% | 8.37% |
| Tampa-St. Petersburg, FL | 3.10% | 1.76% | 1.18% | 1.36% |
| Tucson, AZ | 6.05% | 2.88% | 1.30% | 2.48% |
| Virginia Beach-Norfolk, VA-NC | 3.17% | 2.34% | 1.45% | 1.67% |
| Washington, DC-VA-MD-WV | 47.07% | 26.26% | 6.30% | 13.85% |
| Sources: 2006-2010 ACS & Demographia Central Business Districts | ||||
Wendell Cox is principal of Demographia, an international pubilc policy and demographics firm. He is a Senior Fellow of the Center for Opportunity Urbanism (US), Senior Fellow for Housing Affordability and Municipal Policy for the Frontier Centre for Public Policy (Canada), and a member of the Board of Advisors of the Center for Demographics and Policy at Chapman University (California). He is co-author of the "Demographia International Housing Affordability Survey" and author of "Demographia World Urban Areas" and "War on the Dream: How Anti-Sprawl Policy Threatens the Quality of Life." He was appointed to three terms on the Los Angeles County Transportation Commission, where he served with the leading city and county leadership as the only non-elected member. He served as a visiting professor at the Conservatoire National des Arts et Metiers, a national university in Paris.
Photo: Chicago CBD, with 11 percent of metropolitan employment, with the balance of the city of Chicago and the expansive suburbs beyond (by author).


