NewGeography.com blogs
The restoration of central city living and working environments has been one of the more important developments in the nation’s metropolitan areas over the past two decades. Regrettably, a good story has been exaggerated out of all proportion in the print, electronic and online media.
Exaggerating Core Population Increases: The rise of population in urban cores has been important, but it has too often been used to suggest the apparent, but fallacious opposite, suburban decline. In fact, the suburbs are hardly in decline, with 93.5 percent of major metropolitan area growth outside a 10 mile radius from city hall between the 2000 and 2010 censuses (See: Flocking Elsewhere: The Downtown Growth Story).
Exaggerating CBD Office Space Gains: Similar misinformation had been circulating about office space outside the nation’s CBDs (central business districts, or “downtowns”). Commercial real estate information company Costar’s Randyl Drummer recently described suburbia’s improving fortunes (See: Once Left for Dead, Suburban Office Making a Comeback).
“Some analysts wrote the obituary of the suburban office campus as downsizing companies shed millions of square feet, in many cases consolidating into buildings closer to public transit in urban centers.”
It’s just not happening, according to Costar research:
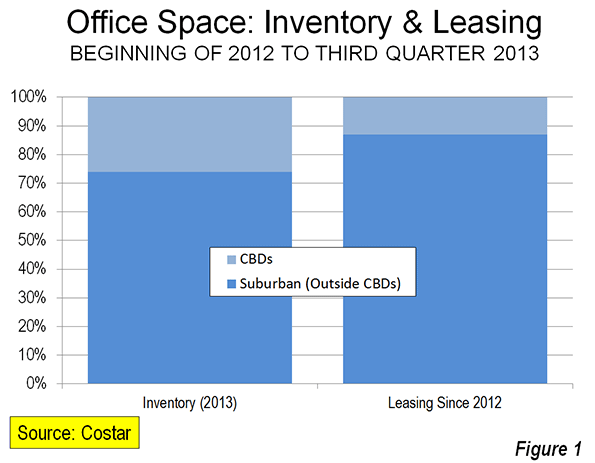
“Overall, the suburbs have garnered more than their usual share of leasing demand over the past two years, according to an analysis by CoStar real estate economists. Since the beginning of 2012, suburban markets have accounted for a whopping 87% of office demand -- which is 13% more than their 'fair share' based on the total market size compared with CBD office markets, according to data presented at CoStar’s recent third-quarter office review and forecast.”
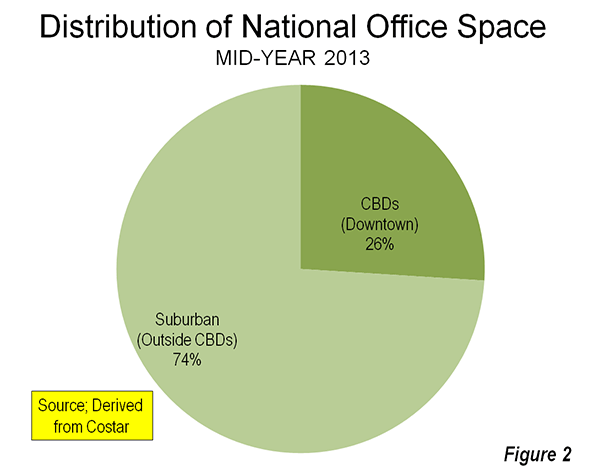
Indeed, CBD leasing, at 13 percent of the total, is a full 50 percent below their current share of inventory (Figure 1). As of mid-2013, the suburbs accounted for nearly three quarters of the nation’s office inventory (Figure 2).
Costar cites strong suburban development in Raleigh’s Research Triangle, and further notes that:
A diverse set of markets that include Sacramento, San Jose, Austin, Kansas City and Charlotte have posted some of the strongest net office absorption among suburban markets.
This is despite the glowing publicity being given to core area development, especially in places like Charlotte and Austin.
The reality is that the monumental CBD towers dominating metropolitan skylines do not indicate downtown dominance. In fact, throughout the high income world, most metropolitan employment is outside CBDs. In the United States, typically 90 percent of employment is outside the CBDs. The suburban employment (outside the CBD) share is a bit smaller in Western Europe, Canada and Australia, but still averages approximately 80 percent or more.
The good news is that neither suburbia nor downtown is dead.
Aaron Renn's recent piece on the Rust Belt has some formidable strengths that can be the foundation of its revitalization, but it has a set of structural problems that must be confronted to achieve true revitalization. Current revitalization strategies, he suggests, are outside of each city's system or fail to bring the appropriate heft to lift all those who need lifting -- largely because they only obliquely address the structural challenges. The challenges:
- Racism
- Corruption
- Closed societies
- Two-tiered environment and resulting paralysis
I won't rehash Aaron's assessment, but I do agree with it.
What occurred to me is that, if you think about it, the South's cities were in the same position following the Civil War -- and faced the same obstacles -- until after World War II. Racism clearly plagued Southern metros and hindered growth during that era; many places were well known for their corruption. The South certainly had a reputation for being a closed society, unwelcome to outsiders, and its history of reliance on low- and moderately-skilled labor made the South perhaps more skeptical of highly educated labor, just like in the Midwest.
Following World War II, however, Southern metros began to make great strides to catch up with and even surpass Northeastern and Midwestern cities. I'm no scholar on post-war Southern growth, but it appears Southern metros took on these strategies to move upward and onward:
Tolerate Newcomers. After World War II Southern cities realized that they could no longer rely on intra-region growth if they were going to prosper, particularly during a period with widespread migration of blacks to Northern cities at the time. Southern business leaders rightfully recognized opportunities to bring businesses and residents to the South from other parts of the country.
Seeing education as an asset. It's no coincidence that the Southern metros that have developed the strongest post-war economies -- Atlanta, Charlotte, Dallas, Houston, Austin, Raleigh, Nashville -- are home to significant educational institutions. After the war the colleges and universities of large Southern metros became integral to their growth.
Becoming a low-cost alternative to the rest of the country. Prior to their turnaround Southern cities probably described themselves in terms of what they lacked in comparison to Northern cities. They did not have the impressive skylines, the classic neighborhoods, the exceptional park systems or the infrastructure that were the legacy of Northern cities. However they did have cheap land and cheap labor, and those factors became the driver that facilitated the development of what they lacked.
The above strategies, combined with the widespread use of air conditioning that made the Southern climate more tolerable, allowed for the growth of Southern metros.
The Rust Belt should take note. While the South only address race as the federal government made them, perhaps the Rust Belt can become a leader in addressing race matters. If the South can learn to become more tolerant of outsiders, the Midwest can as well; it does have a legacy of immigration that can serve as a foundation. Advocates of the Rust Belt Chic movement may turn the low-cost strategy on its head -- the Rust Belt has a unique physical and social legacy that those who've grown up in places with less would welcome. And the Rust Belt has perhaps the greatest collection of public research universities in the nation (even if most are located in smaller metros and not the big cities), and they could be a huge driver of revitalization.
Clearly, the South did not get everything right. But when faced with an existential crisis not unlike what the Rust Belt faces today, they adapted. The Rust Belt must find its strengths and play to them.
A couple weeks ago, noting the apparently immunity of global city Chicago to problems elsewhere in the city, I asked the question: What happens when global city Chicago realizes there’s a good chance it can simply let the rest of the city fail and get on with its business?
I’d argue we’re seeing the results right before our eyes.
At the same time murders in significant parts of the city are even higher than during the peak of the crack epidemic, when the city says its too poor to hire more cops, when 54 schools are closed and a 1000 teachers laid off, half the mental health clinics closed, libraries cut back, etc., Chicago has found a nearly limitless stream of money for elite amenities, most recently – and appallingly – $50+ million in TIF subsidies for a new DePaul arena. There’s also been hundreds of millions of dollars more in corporate welfare under Daley and Rahm.
Investing in success is a great idea – if you plan to harvest a return on that investment to fund city services and your safety net. It’s clear there’s no intention of doing this in Chicago. I discuss this in my most recent City Journal piece, “Well-Heeled in the Windy City.” Here’s an excerpt:
Clearly, cities like Chicago must retain a substantial portion of upscale residents and businesses. Detroit and other cities show the results of failure on this front. Yet the moral case for elite amenities has always rested on the assumption of a broader public good: what benefited the wealthy would also make life better for the rest of the city….Under Emanuel’s leadership, though, Chicago has made peace with a two-tier society and broken the social contract. Rather than trying to expand opportunity, Chicago has bet its future on its already successful residents—leading some on the left to call Emanuel Mayor 1 Percent. The Windy City isn’t alone in following this strategy. Detroit has gone bankrupt, but that hasn’t stopped city government from lavishing $450 million in subsidies on a new Red Wings arena.
Since I critique bike infrastructure as part of Chicago’s splurge for the elite, I want to clarify that point here where there are lots of bike advocates. I strongly support bike infrastructure. In fact, I once gave a presentation where I said protected bike lanes and bike share should be Rahm’s top two transport priorities on taking office because they are cost-effective and can leverage outside funds. However, even the most passionate advocates must admit that the optics are bad on making a full court press on bike lanes when cutting core services elsewhere. More importantly, Rahm’s explicit rationale on bike infrastructure has been luring talent for the tech economy, thus it is an elite focused venture. For example, the Sun-Times reported:
Emanuel called protected bike lanes central to the city’s sustainability plan and his efforts to make Chicago the high-tech hub of the Midwest. Chicago “moved up dramatically” in the list of major cities whose employees bike to work, he said.
“It’s part of my effort to recruit entrepreneurs and start-up businesses because a lot of those employees like to bike to work,” he said.
“It is not an accident that, where we put our first protected bike lane is also where we have the most concentration of digital companies and digital employees. Every time you speak to entrepreneurs and people in the start-up economy and high-tech industry, one of the key things they talk about in recruiting workers is, can they have more bike lanes.”
I’m simply taking the mayor at his word. (See also here and here).
This piece originally appeared at The Urbanophile.
by Anonymous 10/09/2013
Since Rahm Emanuel entered the political scene years ago, he’s been a master at manipulating the press to his benefit. A pliant media has largely gone along with whatever talking point Emanuel desired. Lately, some of the media has begun to put the spotlight on violent Chicago with its rather high murder rate. Banning or restricting handguns has not been very successful in combatting violence in Chicago. The website Big Government reports the bloody details:
After Chicago recorded a terrible homicide total of 53 in August, September wasn't much better for Rahm's "world class" city. The city suffered 41 homicides, 30 of which resulted from 184 total shootings.
September brings more bad news for Chicago residents. While Mayor Rahm Emanuel, Police Superintendent Garry McCarthy, and the Chicago media have continued to hammer the point that the "crime rate is down," and "murder is down," as of September 22, the homicide total for 2013 now exceeds the rate up to the same date in 2011 by two percent at 350, according to the Chicago Police Crime Data Portal.
How does today’s Chicago hold up at the violent memory of Al Capone’s Chicago of the 1920s? Not very well. WLS-TV investigated the data and the evidence is rather stunning report in February:
Let's compare two months: January 1929, leading up to the St. Valentine's Day Massacre, and last month, January 2013. Forty-two people were killed in Chicago last month, the most in January since 2002, and far worse than the city's most notorious crime era at the end of the Roaring Twenties.
Even though the image of Chicago, perpetuated by Hollywood over the years, was that mobsters routinely mowed down people on the streets, the crime stats tell us that we were safer under Capone than Emmanuel. In January 1929 there were 26 killings. Forty-two people were killed in Chicago last month, the most in January since 2002.
Even though the image of Chicago, perpetuated by Hollywood over the years, was that mobsters routinely mowed down people on the streets, the crime stats tell a different story. The figures from January 2013 are significantly higher than the January of Al Capone's most famous year.
It’s not just the Capone era violence that doesn’t hold up to scrutiny. Constantly we hear from the media and advocates of gun control that we don’t want things to become “the Wild West”. In the last several years, historians have begun to look at this long time legend that was promoted by Hollywood movies. As Ryan McMaken explains:
Historian Richard Shenkman largely attributes this to the legacy of those reliably-violent Western films. "Many more people have died in Hollywood Westerns than ever died on the real Frontier…[i]n the real Dodge City, for example, there were just five killings in 1878, the most homicidal year in the little town's Frontier history: scarcely enough to sustain a typical two-hour movie."
The old West with its minimal government and armed populace has never been too popular with progressives. But, the reality is it was never really violent according to Terry Anderson and Peter Hill. So, the murder rate of the Capone era and Dodge city of 1878 would be a major improvement for Mayor Rahm Emanuel.
Note: This post was originally incorrectly attributed to Wendell Cox.
Congratulations to Bob Day, who was elected as a federal Senator from South Australia. Day was one of six Senators elected from the state in the September 7 election. While most of the seats in the lower house of Parliament were quickly decided, the Senate seats too considerably longer under Australia’s preferential voting system. According to the Australian Broadcasting Company, Day’s election and that of the other five Senators was confirmed on October 2.
Day is an ultimate entrepreneur, having founded Home Australia and related companies that has emerged as a leading home builder across the nation. He served a term as President of the Housing Industry Association. Day has also been a newgeography.com author, writing a piece on one of his passions, the importance of restoring housing affordability in Australia (see The Land Premium that’s Punishing Property).
|


