
In their new book, Harvard economists Edward Glaeser and David Cutler characterize COVID and related issues as an “existential threat to the urban world, because the human proximity that enables contagion is the defining characteristic of the city” (see our review, Survival of the City: The Need to Reopen the Metropolitan Frontier (Review).
Exposure Density
The problem for cities was stressed in an open letter from 239 scientists to the World Health Organization, “Studies by the signatories and other scientists have demonstrated beyond any reasonable doubt that viruses are released during exhalation, talking, and coughing in microdroplets small enough to remain aloft in air and pose a risk of exposure at distances beyond 1 to 2 m from an infected individual.” They added: This problem is especially acute in indoor or enclosed environments, particularly those that are crowded and have inadequate ventilation relative to the number of occupants and extended exposure periods.
In the past , we have suggested the use of “exposure density” --- a radiological term used to assess the proximity and duration of exposure --- as appropriate of COVID analysis in an April 2020 article (see “Exposure density and the pandemic”).
Research published earlier this year estimates how the reduction in neighborhood level exposure densities in New York City reduced COVID infection and fatality rates. Comparing rates before and after the stay-at-home order that was effective March 22, 2020, Boyeong Hong, Bartosz J. Bonczak , Arpit Gupta, Lorna E. Thorpe , and Constantine E. Kontokosta of the Marron Institute of Urban Management, New York University associated a 1.00 percent reduction in exposure density with a 1.33 reduction in case rate and a larger 1.59 percent reduction in fatality rates in New York City (See: Exposure density and neighborhood disparities in COVID-19 infection risk)
Update on COVID Fatalities
Fatality rates data continue to show an association between higher county urban densities and their fatality rates. Urban density is used as a surrogate for the overcrowding that increases exposure density. The issue is not density per se, however, but consistent with crowding which is often found in dense urban areas.
The latest fatality rates as of August 31, 2021 from COVID-19 are shown in Figure 1. This is derived from data reported by usafacts.org. The data includes all the pandemic period, that began in the first quarter of 2020.
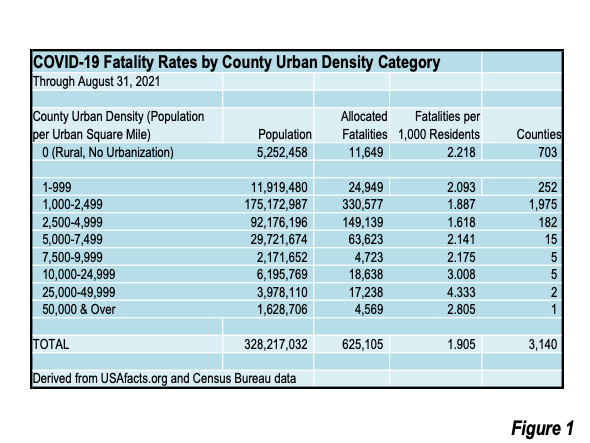
The counties with lower urban densities of 1,000 to 5,000 per square mile or below --- continue to do better in terms of death rates, at or below the national death rate in (Figure 2). These counties account for 81% of the nation’s population (267 million out of a total population of 328 million).
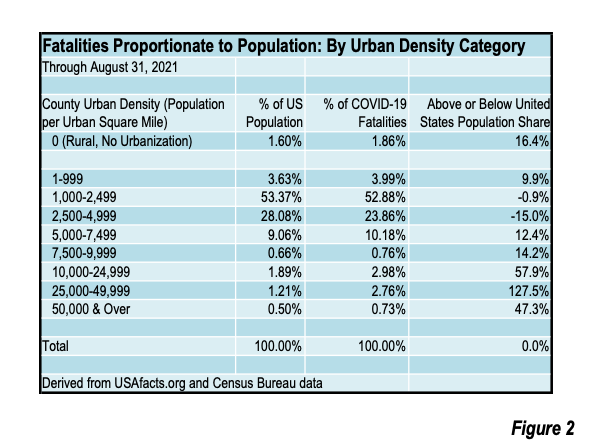
All categories of counties with urban densities exceeding 5,000 per square mile have more than their population proportionate share of COVID-19 deaths. Areas with urban densities below 1,000 per square mile (including rural areas) have higher than average death rates. The fully rural counties (without urban areas), death rate remains 16% above the national average, slightly above the end of 2020. Urban density categories above 10,000 per square mile have death rates more approximately one-half or more above the national average.
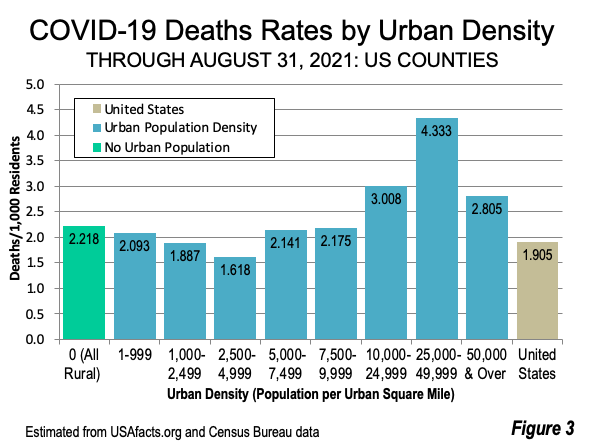
The death rates in counties with higher urban densities have improved materially since our first report (July 9, 2020), when they were a minimum of 350% higher than the national average --- seven times the current average. The earlier rates were far more influenced by the pre-lockdown fatality data, with improvements as the lockdown period has extended at least a year. But they remain considerably higher than less dense areas and rural ones at all.
Figure 3 illustrates the current fatality rates by urban population density category.
The Toll on the Largest Central Business Districts
As important as the measures have been in reducing exposure densities,much of this has come from the mass abandonment of the most crowded enclosed city environments have been substantial, especially on the hyper-dense central business districts (downtowns), which have been characterized as “ghost towns.” It is worth noting that employment densities in Manhattan (the largest US central business district) reach about four times the highest neighborhood (residential) densities (See here and here).
The largest downtowns are far more dependent on enclosures such as elevators and transit commuting than elsewhere in metropolitan areas, as social distancing requirements have decimated the extent of use by workers. Nearly half or more of workers to the largest downtowns (New York, Chicago, San Francisco, Boston, Philadelphia and Washington) had commuted by transit before the pandemic.
In August, only 23% of Manhattan workers were physically at work, with 44% of employers delaying returns because of the recent rise in COVID-19 cases due to the Delta variant.
In May, downtown San Francisco was reported to have only 15% of its workers at their jobs. The BART regional metro had ridership in August had ridership 78% below the same month in pre-pandemic 2019.
In July, Metra, the Chicago area’s principal commuter rail agency, reported ridership down 75% from pre-pandemic levels and has set a goal of ridership down 70% by the end of the year.
Overcrowded Housing
While the policy responses to COVID have reduced exposure densities in crowded employment and transit environments, such policies are not as easily applied in the overcrowded housing that includes so many in poverty. A Furman University study on New York City found: “Neighborhoods with higher rates of confirmed COVID-19 cases have lower median incomes, higher shares of residents who are Black or Hispanic, and higher shares of residents under the age of 18 relative to less affected neighborhoods. Residents of these neighborhoods are less likely to be able to work from home, disproportionately rely on public transit during the crisis, and are less likely to have internet access.”
An Uncertain Future
Polling cited in research by Jose Maria Barrero (Instituto Tecnologico Autonomo de Mexico) Nicholas Bloom (Stanford University) and Steven J. Davis (University of Chicago) indicated that “once most of the population had been vaccinated ”nearly three quarters of the working age population would not completely return to pre-COVID work activities”.
Moreover, the continued emergence of COVID variants, combined with the reluctance of some to be vaccinated are strong indicators that the future of work and the most crowded parts of cities (whether residential or employment) may not return soon to “business as usual.”
Wendell Cox is principal of Demographia, an international public policy firm located in the St. Louis metropolitan area. He is a founding senior fellow at the Urban Reform Institute, Houston, a Senior Fellow with the Frontier Centre for Public Policy in Winnipeg and a member of the Advisory Board of the Center for Demographics and Policy at Chapman University in Orange, California. He has served as a visiting professor at the Conservatoire National des Arts et Metiers in Paris. His principal interests are economics, poverty alleviation, demographics, urban policy and transport. He is co-author of the annual Demographia International Housing Affordability Survey and author of Demographia World Urban Areas.
Mayor Tom Bradley appointed him to three terms on the Los Angeles County Transportation Commission (1977-1985) and Speaker of the House Newt Gingrich appointed him to the Amtrak Reform Council, to complete the unexpired term of New Jersey Governor Christine Todd Whitman (1999-2002). He is author of War on the Dream: How Anti-Sprawl Policy Threatens the Quality of Life and Toward More Prosperous Cities: A Framing Essay on Urban Areas, Transport, Planning and the Dimensions of Sustainability.
Photograph: Midtown Manhattan. Highest density employment in the United States (by author).


