City Sector Model

Demographia World Urban Areas, 2020: Tokyo Lead Diminishing

DUA-2020.jpg

For the first time in more than six decades the world’s second ranked built-up urban area has reached within 10% of leader Tokyo. The 2020 edition of Demographia World Urban Areas reports that Jakarta has reached a population of 34.5 million, behind Tokyo-Yokohama’s 38.0 million (Figure 1). The report can be downloaded here (Note 1).  read more »

Employment by CIty Sector, Challenges Ahead for Downtowns

woolworth-bldg.jpg

New Census Bureau employment data indicates that most job creation in the nation’s 53 major metropolitan areas (over 1,000,000 population) continues to be in the suburbs and exurbs. This article describes employment (job) locations by urban sector, using the City Sector Model (described in the Note Figure 4, below). The source of the data is “County Business Patterns, which is published annually for every zip code in the nation, which is unlike the American Community Survey, which uses a five-year period to cover all areas of the nation.  read more »

Towards a Better Urbanism

sean-pollock-PhYq704ffdA-unsplash.jpg

The pandemic has brought panic to the once-confident ranks of urbanists promoting city density.  read more »

Dispersion in US Metros Increases Even Before COVID-19: New Census Estimates

phoenix_metro_2020.jpg

The latest US Census Bureau metropolitan area population estimates (for 2019) were largely lost in the coverage of the COVID-19 pandemic.  read more »

The Coming Age of Dispersion

Shanghai_China_paveldvorak.jpg

As of this writing, the long-term effects of the coronavirus pandemic remain uncertain. But one possible consequence is an acceleration of the end of the megacity era. In its place, we may now be witnessing the outlines of a new, and necessary, dispersion of population, not only in the wide open spaces of North America and Australia, but even in the megacities of the developing world.  read more »

Transit Conundrum: Losses Greatest in Areas with Best Service in Los Angeles

la-from-north-hollywood.jpg

In Los Angeles County, the nation’s most populous and core of the nation’s most densely populated urban area, transit commuting is dropping fastest in areas with the most comprehensive transit service. This is illustrated by an examination of the 5-year trend from 2008-2012 (middle year 2010) to 2013-2017 (middle year 2015) for Public Use Microdata Areas (PUMAs).  read more »

A Walk Around Downtown Cincinnati

Carew_Tower_Cincinnati_Ohio.jpg

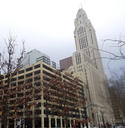
Recently I had to outrun a snowstorm, by driving to reach an appointment in Columbus (Ohio), out of fear that by morning the St. Louis airport might be closed (or the flight might be cancelled). This gave me the chance to stop by downtown Cincinnati, on the way home.  read more »

Be Careful When Citing Jane Jacobs: Her Conclusions Don’t Always Hold

Jane_Jacobs.jpg

As a professor who teaches about cities and the urban form, I very much appreciate the sidewalk ballets and street-corner societies that have historically existed in our nation’s urban centers. These features of the built-environment have long been powerful factors in the formation of both social capital, community, and a place’s identity.  read more »

Sydney High-Density Planning

Clifftop_hilly_homes_in_Vaucluse_eastern_suburbs_Sydney_Australia.jpg

High-density planning policies have become fashionable and Sydney planners are among the most enthusiastic adopters. New South Wales Government authorities claim that high density policies result in a reduction of greenhouse gas emissions (gge), provide improved housing affordability and result in reduced traffic congestion. No evidence has been provided to justify these assertions. Such claims need to be investigated as well as density’s detrimental effect on amenity and quality of life should also be investigated.  read more »

Population Growth Concentrated in Auto Oriented Suburbs and Metropolitan Areas

chi-subs-2019.jpg

The suburbs and exurbs continue to dominate population growth in the nation’s 53 major metropolitan areas, according to a City Sector Model (Note 1 and Figure 9) analysis. We traced growth between the 2010 Census and the American Community Survey 5-year data, from samples taken over the period of 2014 to 2018. The middle-year was 2016 (Note 2).

Population Growth by City Sector  read more »